
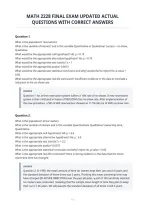
MATH 2228 FINAL EXAM UPDATED ACTUAL
QUESTIONS WITH CORRECT ANSWERS
Question 1.
What is the population? reservations
What is the variable of interest? and is this variable Quantitative or Qualitative? success = no show,
Qualitative
What would be the appropriate null hypothesis? H0: p = 0.10
What would be the appropriate alternative hypothesis? Ha: p < 0.10
What would be the appropriate test statistic? z = 1
What would be the appropriate pvalue? 0.8413
What would be the appropriate statistical conclusion and why? accept (fail to reject) Ho, p-value >
0.05
What would be the appropriate real-life conclusion? insufficient evidence in the data to conclude a
reduction in the no-show rate
ANSWER
Question 1: An airline reservation system suffers a 10% rate of no-shows. A new reservation
system is then instituted in hopes of REDUCING this no-show rate. After implementation of
the new procedure, a SRS of 400 reservations showed an 11.5% (46 out of 400) no-show rate.
Question 2.
What is the population? all car owners
What is the variable of interest and is this variable Quantitativeor Qualitative? ownership time,
Quantitative
What is the appropriate null hypothesis? H0: μ = 6.6
What is the appropriate alternative hypothesis? Ha: μ ` 6.6
What is the appropriate test statistic? z = 2.2
What is the appropriate pvalue? 0.0278
What is the appropriate statistical conclusion and why? reject Ho, p-value < 0.05
What is the appropriate real-life conclusion? there is strong evidence in the data that the mean
ownership time has changed
ANSWER
Question 2: In 1990, the mean amount of time car owners kept their cars was 6.6 years and
the standard deviation of these times was 3 years. Thinking this mean ownership time may
have changed (IN EITHER DIRECTION) over the past decades, a poll of 100 randomly selected
car owners was conducted, revealing that the sample mean length of time they plan to keep
their car is 7.26 years. We will assume the standard deviation of all times is still 3 years.
1/6
, Question 3.
Determine the sample mean. 5e ¯= __________ pounds per hour. 71 Determine the sample standard
deviation. 5` = __________ pounds per hour. 14.53
the appropriate value for t is 4.303
using the df = 2
The appropriate CF is not applicable in this problem since N not given
The appropriate n is 3
The 95% confidence interval reduces to 71 ± 36.1. Based on this confidence interval, can we
confidently conclude that catalyst XA-100 increases the mean hourly yield? no, some numbers in the
interval are under 50
ANSWER
Question 3: A production supervisor at a major chemical company wishes to determine μ, the
new mean hourly yield for a chemical process (it used to be 50 pounds per hour) in the
presence of a new catalyst XA-100. The supervisor does 3 one-hour trial runs with catalyst
XA-100 and observes the following yields (in pounds per hour)
72, 56, 85
The population is all one-hour time periods and we are interested in the yields in the
presence of the new catalyst. Assume the population is normal.
Question 4.
Identify the population: all exams
What is the variable of interest and is this variable Quantitative or Qualitative? success = answer q13
correctly, Qualitative Determine 5] 0.368
Determine the appropriate value for z. 1.44
Determine the appropriate value for CF. 0.707
Determine the appropriate value for n. 125
Based on the interval formed above, can the professor confidently conclude that question 13 will be
dropped? AND WHY ? no, because the interval extends above 45%
Suppose the professor has an assistant that is assigned to grade the other half of the exams. If the
professor asks the assistant to grade the other 125 exams and use the data to also create an 85%
confidence interval for the proportion of students correctly answering question 13 in the class, what
is the chance the interval the assistant creates will contain the true percentage of students in the
entire class correctly answering question 13? 85%
ANSWER
2/6


