
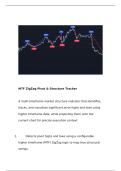
MTF ZigZag Pivot & Structure Tracker
A multi-timeframe market structure indicator that identifies,
tracks, and visualizes significant pivot highs and lows using
higher timeframe data, while projecting them onto the
current chart for precise execution context.
1. Detects pivot highs and lows using a configurable
higher timeframe (MTF) ZigZag logic to map true structural
swings.
, 2. Tracks real-time formation of HTF candles to accurately
anchor pivots to the exact bar where structure forms.
3. Draws dynamic ZigZag lines to visualize market
direction and structural transitions between highs and lows.
4. Generates percentage-based move labels between
pivots to quantify momentum and expansion.
5. Plots optional price labels at each pivot for precise level
identification.
6. Extends horizontal lines from historical pivots to
highlight key support and resistance zones.
7. Includes optional Bollinger Bands and EMA overlays for
additional context on volatility and trend.
8. Uses array-based state management to efficiently
store, update, and limit historical pivot data.
9. Provides alerts for newly formed higher timeframe
pivot highs and lows.
// This source code is subject to the terms of the Mozilla Public License 2.0 at
https://mozilla.org/MPL/2.0/
// MTF ZigZag Pivots with Touch Tracking
// Based on "Zig Lines with Percent & Value" by mmoiwgg
// © rr2009com
//@version=6


