MATH 1280 Introduction to Statistics 182 q’s &
Certified Solutions.
The population in this survey is: - Answer: The target of the survey is to assess the service that
costumers get at the dealerships.
The correct answer is: Customers that arrive at dealerships of the company.
The sample in this survey is: - Answer: that arrive at the selected dealerships during the day of
visit.
A parameter that may be targeted by this survey is: - Answer: The percentage of costumers that
possess a car made by the company.
Page 1 of 24
,Number of students enrolled at Evergreen Valley College. - Answer: quantitative/numeric
Distance to the closest movie theater. - Answer: quantitative/numeric
Number of competing computer spreadsheet software packages. - Answer:
quantitative/numeric
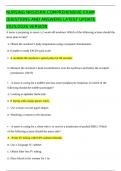
In Figure A you will find box plots for three sets of data. In Figure B are the histograms for the
same sets of data, but in a different order. Associate each box plot with its relative histogram -
Answer: Box plot 1 → Histogram b, Box plot 2 → Histogram a, Box plot 3 → Histogram c
Consider the box plots in Figure A. Which of the data has a smaller inter-quartile range (IQR)? -
Answer: Box plot 3
For the next 3 question deal with the following data:
11.9, 11.0, 12.4, 16.9, 16.3, 13.3, 9.1, 17.0, 11.0, 9.3, 25.3, 17.4, 17.4 - Answer:
The median is equal to: - Answer: 13.3
The largest value in the data is an outlier: - Answer: False
The smallest value in the data is an outlier: - Answer: False
Page 2 of 24
, Create an R data frame with the name "ex.2" that contains the data in the file "ex2.csv" (Select
the file name to download it).
Compute the standard deviation of each of the numeric variables. Among the following, the
variable with the largest standard deviation is: - Answer: diastolic
Twenty-one randomly selected students were asked the number of pairs of sneakers they
owned. The number of pairs of sneakers owned by each student was recorded in an R object by
the name "x". The frequency table of the data "x" is:
> table(x) x 1 2 3 4 5 6 4 7 3 3 2 2
Based on this table compute: - Answer:
sample mean (x̅) - Answer: 2.904762
The sample standard deviation (s) is - Answer: 1.609496
The first quartile (Q1) is - Answer: 2
The median is - Answer: 2
The third quartile (Q3) is - Answer: 4
The distribution is skewed to the left? (True or False) - Answer: False
Page 3 of 24
Certified Solutions.
The population in this survey is: - Answer: The target of the survey is to assess the service that
costumers get at the dealerships.
The correct answer is: Customers that arrive at dealerships of the company.
The sample in this survey is: - Answer: that arrive at the selected dealerships during the day of
visit.
A parameter that may be targeted by this survey is: - Answer: The percentage of costumers that
possess a car made by the company.
Page 1 of 24
,Number of students enrolled at Evergreen Valley College. - Answer: quantitative/numeric
Distance to the closest movie theater. - Answer: quantitative/numeric
Number of competing computer spreadsheet software packages. - Answer:
quantitative/numeric
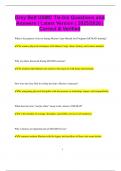
In Figure A you will find box plots for three sets of data. In Figure B are the histograms for the
same sets of data, but in a different order. Associate each box plot with its relative histogram -
Answer: Box plot 1 → Histogram b, Box plot 2 → Histogram a, Box plot 3 → Histogram c
Consider the box plots in Figure A. Which of the data has a smaller inter-quartile range (IQR)? -
Answer: Box plot 3
For the next 3 question deal with the following data:
11.9, 11.0, 12.4, 16.9, 16.3, 13.3, 9.1, 17.0, 11.0, 9.3, 25.3, 17.4, 17.4 - Answer:
The median is equal to: - Answer: 13.3
The largest value in the data is an outlier: - Answer: False
The smallest value in the data is an outlier: - Answer: False
Page 2 of 24
, Create an R data frame with the name "ex.2" that contains the data in the file "ex2.csv" (Select
the file name to download it).
Compute the standard deviation of each of the numeric variables. Among the following, the
variable with the largest standard deviation is: - Answer: diastolic
Twenty-one randomly selected students were asked the number of pairs of sneakers they
owned. The number of pairs of sneakers owned by each student was recorded in an R object by
the name "x". The frequency table of the data "x" is:
> table(x) x 1 2 3 4 5 6 4 7 3 3 2 2
Based on this table compute: - Answer:
sample mean (x̅) - Answer: 2.904762
The sample standard deviation (s) is - Answer: 1.609496
The first quartile (Q1) is - Answer: 2
The median is - Answer: 2
The third quartile (Q3) is - Answer: 4
The distribution is skewed to the left? (True or False) - Answer: False
Page 3 of 24