Exercise 28: Calculating Pearson Product-
Moment Correlation Coefficient
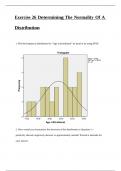
1. If you have access to SPSS, compute the Shapiro-Wilk test of normality for the variables visitor
2. frequency and length of stay (as shown in Exercise 26). If you do not have access to SPSS, plot
the frequency distributions by hand. What do the results indicate?
-The Shapiro-Wilk p values for length of stay and visitor frequency were 0.242 and 0.155
respectively, indicating that the frequency distributions did not significantly deviate from
normality. In addition, visual inspection of the frequency distributions indicates that the
variables are approximately normally distributed.
2. What is the null hypothesis in the example?
-“There is no correlation between length of stay and visitor frequency among residents of
residential care facilities.”
3. What is the Pearson r between visitor frequency and length of stay?
-It is r=0.614
4. Is the r significant at alpha=0.05? Provide rationale.
Moment Correlation Coefficient
1. If you have access to SPSS, compute the Shapiro-Wilk test of normality for the variables visitor
2. frequency and length of stay (as shown in Exercise 26). If you do not have access to SPSS, plot
the frequency distributions by hand. What do the results indicate?
-The Shapiro-Wilk p values for length of stay and visitor frequency were 0.242 and 0.155
respectively, indicating that the frequency distributions did not significantly deviate from
normality. In addition, visual inspection of the frequency distributions indicates that the
variables are approximately normally distributed.
2. What is the null hypothesis in the example?
-“There is no correlation between length of stay and visitor frequency among residents of
residential care facilities.”
3. What is the Pearson r between visitor frequency and length of stay?
-It is r=0.614
4. Is the r significant at alpha=0.05? Provide rationale.