Exercise 26 Determining The Normality Of A
Distribution
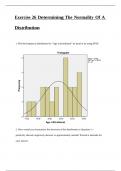
1. Plot the frequency distribution for “Age at Enrollment” by hand or by using SPSS.
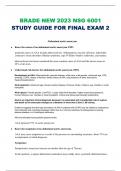
2. How would you characterize the skewness of the distribution in Question 1—
positively skewed, negatively skewed, or approximately normal? Provide a rationale for
your answer.
Distribution
1. Plot the frequency distribution for “Age at Enrollment” by hand or by using SPSS.
2. How would you characterize the skewness of the distribution in Question 1—
positively skewed, negatively skewed, or approximately normal? Provide a rationale for
your answer.