Supply and Demand
2
1. Is there a difference between movements along a demand curve and shifts in a demand curve? How would
you explain this difference to a friend who is taking this course and is confused about the issue?
Solution
1. A movement along the demand curve takes place when a change in price induces a change in the quantity
demanded. Hence, movements along the demand curve occur only when the price of the good changes. A
shift in the demand curve takes place when any nonprice determinant of demand is changed. A nonprice
determinant of demand is a factor that may change a consumer’s behavior. This includes, for example,
changes in the number of consumers, the consumer’s income or wealth, tastes, and prices of other goods.
2. The demand for organic carrots is given by the following equation:
QD
O = 75 – 5PO + PC + 2I
where PO is the price of organic carrots, PC is the price of conventional carrots, and I is the average con-
sumer income. Notice how this isn’t a standard demand curve that just relates the quantity of organic car-
rots demanded to the price of organic carrots. This demand function also describes how other factors affect
demand — namely, the price of another good (conventional carrots) and income.
a. Draw the demand curve for organic carrots when PC = 5 and I = 10.
b. Using the demand curve drawn in (a), what is the quantity demanded of organic carrots when PO = 10?
c. Using the demand curve drawn in (a), what is the quantity demanded of organic carrots when PO = 5?
d. Now, suppose PO = 10 and PC = 15 (I remains at 10). What is the quantity demanded of organic car-
rots? Compared with your answer in (b), has there been a change in demand or quantity demanded?
Demonstrate using a graph.
e. What happens to the demand for organic carrots when the price of conventional carrots increases? Are
organic and conventional carrots complements or substitutes?
f. What happens to the demand for organic carrots when the average consumer income increases? Are
carrots a normal or an inferior good?
Solution
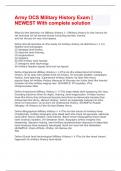
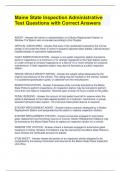
2. a. The demand curve for organic carrots when
PC = 5 and I = 10 becomes
Price
($/unit)
20 [2EOCUN01 goes
QD
O = 75 – 5PO + 5 + (2 × 10) = 100 – 5PO
here; 2EOC01]
In other words,
5PO = 100 – QD
O
PO = 20 – _1 QD
5 O
b. For PO = 10, the quantity demanded is D
QD
O = 100 – (5 × 10) = 50 0 100
c. When PO = 5, the quantity demanded of or- Quantity of organic carrots
ganic carrots is
QD
O = 100 – (5 × 5) = 75
d. Suppose PO = 10 and PC = 15, and I = 10; then
QD
O = 75 – 5PO + 15 + (2 × 10) = 75 – (5 × 10) + 15 + (2 × 10) = 60
,2 Part 1 Basic Concepts
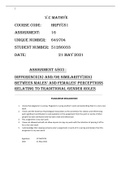
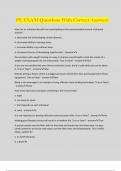
Thus, there has been a change in the quantity Price
demanded due to the change in the price of con- ($/unit)
ventional carrots, which leads to an outward shift 22
20
in the demand curve for organic carrots. The new
function represented by D 2 is
QDO = 75 – 5PO + 15 + (2 × 10) = 110 – 5PO
10
→ PO = 22 – _ 1 QD
5 O
e. When the price of conventional carrots increases,
D1 D2
the demand for organic carrots shifts, which leads
to an increase in the quantity demanded for or- 0 50 60 100 110
ganic carrots at the original price. Quantity of organic carrots
f. An increase in income shifts out the demand
curve for organic carrots. Hence, as the average consumer income increases, the quantity demanded of
organic carrots increases. Such an observation is consistent with the definition of a normal good.
3. Out of the following events, which are likely to cause the demand for coffee to increase? Explain your answers.
a. An increase in the price of tea
b. An increase in the price of doughnuts
c. A decrease in the price of coffee
d. The Surgeon General’s announcement that drinking coffee lowers the risk of heart disease
e. Heavy rains causing a record-low coffee harvest in Colombia
Solution
3. a. Since tea and coffee are the classic examples of substitutes, as the price of tea increases, the demand
for coffee is likely to increase.
b. An increase in the price of doughnuts decreases the quantity demanded of doughnuts. Because dough-
nuts and coffee are complements, this will likely decrease the demand for coffee.
c. A decrease in the price of coffee will decrease the quantity demanded of coffee via a movement along
the demand curve.
d. The Surgeon General’s announcement will likely increase the number of people who are interested in
drinking coffee and, thus, increase the demand for coffee.
e. Heavy rain will decrease the supply of coffee. This can be shown as an inward shift of the supply curve.
As a result, the equilibrium price increases and the equilibrium quantity decreases. This adjustment is
accomplished via a movement along the demand curve.
4. How is each of the following events likely to shift the supply curve or the demand curve for fast-food
hamburgers in the United States? Make sure you indicate which curve (curves) is affected and if it shifts
out or in.
a. The price of beef triples.
b. The price of chicken falls by half.
c. The number of teenagers in the economy falls due to population aging.
d. Mad cow disease, a rare but fatal medical condition caused by eating tainted beef, becomes common in
the United States.
e. The Food and Drug Administration publishes a report stating that a certain weight-loss diet, which
encourages the intake of large amounts of meat, is dangerous to one’s health.
f. An inexpensive new grill for home use that makes delicious hamburgers is heavily advertised on television.
g. The dollar rises relative to foreign currencies, so that it becomes expensive for foreign tourists to travel
to the United States on vacation.
h. The minimum wage rises.
Solution
4. a. An increase in the price of beef represents an increase in the cost of an input. This will cause the supply
curve to shift in as the production becomes more expensive.
b. Demand for fast-food hamburgers in the United States will likely shift in since many consumers see
chicken and beef as substitutes. As chicken becomes less expensive, more people will consume chicken and
reduce their consumption of hamburgers, resulting in a decrease in the demand for fast-food hamburgers.
c. The demand curve shifts in.
d. Consumers’ awareness of the mad cow disease shifts the demand for fast-food hamburgers in.
, Supply and Demand Chapter 2
e. Fewer people will follow this diet, causing the demand curve to shift in.
f. As consumers purchase the advertised inexpensive new grill, they are more likely to prepare hamburgers
at home. Given that at-home hamburgers and fast-food hamburgers are likely to be substitutes in the
minds of consumers, the demand for fast-food hamburgers can be expected to shift in.
g. The demand curve shifts in due to a decrease in the number of tourists visiting the United States on
vacation.
h. An increase in the minimum wage increases the supplier’s cost of production, which leads to a decrease
in supply. This is shown as a shifting in of the supply curve.
5. Your roommate remarks that it is strange that a flight from New York to Chicago costs more than a flight
from New York to Orlando, since New York and Chicago are closer than New York and Orlando. What is your
roommate assuming about the relationship between distance and price? How do you explain these prices?
Solution
5. The roommate assumes that the price is directly related to the distance and nothing else. The difference in
prices can be attributed to either differences in supply along the two routes or differences in the demand
for travel along the two routes, or most likely, both.
6. Suppose that a hard freeze destroys a large portion of the Florida orange crop. At the same time, the
Journal of the American Medical Association releases the results of a new study showing that drinking
large quantities of orange juice substantially reduces one’s risks of both heart disease and cancer. What is
the likely effect of these two events on the price of orange juice? On the quantity of orange juice sold?
Solution
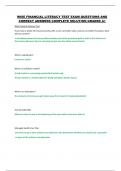
6. The hard freeze causes the supply curve to shift in.
On the other hand, the information released by the
Price
($/unit)
S2
S1
Journal of the American Medical Association
shifts the demand curve out. E2
In this particular scenario, both events will tend P2
to increase the price of orange juice, assuming that
the supply and demand curves are not special cases P1 E1
in terms of elasticity. Yet, the effect on quantity
of orange juice sold is ambiguous as it depends on D1 D2
the magnitude of the shifts in the two curves.
Q1 = Q 2 Quantity of
orange juice
7. Suppose that you have been collecting vintage lightning rods for the past 30 years. When you began, find-
ing lightning rods for sale meant drifting from town to town and antique store to antique store hoping that
you would find a lightning rod for sale. The availability made possible by the Internet now means that you
can easily find hundreds of lightning rods for sale at any given time.
a. Draw a diagram showing how the invention and popularization of the Internet have caused the demand
curve for lightning rods to shift.
b. Suppose that the only change in the market for lightning rods is the change you described in (a). How
would that change affect the equilibrium price of lightning rods and the equilibrium quantity of light-
ning rods sold?
Solution
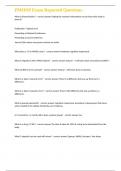
7. a. The invention and popularization of the Inter-
net have caused an increase in the demand for
Price
($/rod)
lightning rods.
D1 D2
Quantity of
lightning rods
, 4 Part 1 Basic Concepts
b. Assuming the supply curve is fixed and not Price S2
a special case in terms of elasticity (as de- ($/rod)
picted below), then the equilibrium price of
lightning rods and the equilibrium quantity S1
will increase. E2
P2
P1 E1
D1
D2
Q2 Q1 Quantity of
lightning rods
Price
8. In March 2002 the retail price of gasoline was ($/barrel) S1990
$1.19 per gallon — exactly the same as it was in
August 1990. Yet, total gasoline production and
consumption rose from 6.6 million barrels per
week in 1990 to 8.7 million barrels per week in $1.19
2002. Using the graph below, draw the appro-
priate shifts in the demand and supply curves to D1990
explain these two phenomena.
0 6.6 Millions of
Solution
8. As stated in the problem, the total consumption
as well as the production of gasoline increased.
Price
barrels/week
S1
($/gallon)
So both supply and demand increase. Shifts are
S2
such that the equilibrium price remains constant
but the equilibrium quantity increases from
6.6 million to 8.7 million, that is, the horizontal E1 E2
price line $1.19 goes through the old and new 1.19
equilibrium points.
D1 D2
0 Q1 Q2 Quantity of
gasoline
9. When the demand for toilet paper increases, the equilibrium quantity sold increases. Consumers are
buying more, and producers are producing more.
a. How do producers receive the signal that they need to increase production to meet the new demand?
b. Does the increased production reflect an increase in supply, or an increase in the quantity supplied?
Explain your answer, referring to (a).
Solution
9. a. Producers independently decide how much to produce of their products given the price at which they
expect to be able to sell them, and consumers show up at stores to buy the good. Sometimes producers
might supply too little in the short run, but through the market, these mistakes tend to be corrected.
The signals producers receive are price signals since shortages or surpluses in the market tend to put
upward or downward pressure on the market price of a good.
b. In this scenario, the increased production reflects an increase in the quantity supplied, not in supply.
An increase in the demand for toilet paper will shift out the demand curve, which will increase the price
of toilet paper and hence the quantity supplied via a movement along the supply curve.
10. Suppose the demand for towels is given by Q D = 100 – 5P, and the supply of towels is given by Q S = 10P.
a. Derive and graph the inverse supply and inverse demand curves.
b. Solve for the equilibrium price and quantity.
c. Suppose that supply changes so that at each price, 20 fewer towels are offered for sale. Derive and graph
the new inverse supply curve.
d. Solve for the new equilibrium price and quantity.
2
1. Is there a difference between movements along a demand curve and shifts in a demand curve? How would
you explain this difference to a friend who is taking this course and is confused about the issue?
Solution
1. A movement along the demand curve takes place when a change in price induces a change in the quantity
demanded. Hence, movements along the demand curve occur only when the price of the good changes. A
shift in the demand curve takes place when any nonprice determinant of demand is changed. A nonprice
determinant of demand is a factor that may change a consumer’s behavior. This includes, for example,
changes in the number of consumers, the consumer’s income or wealth, tastes, and prices of other goods.
2. The demand for organic carrots is given by the following equation:
QD
O = 75 – 5PO + PC + 2I
where PO is the price of organic carrots, PC is the price of conventional carrots, and I is the average con-
sumer income. Notice how this isn’t a standard demand curve that just relates the quantity of organic car-
rots demanded to the price of organic carrots. This demand function also describes how other factors affect
demand — namely, the price of another good (conventional carrots) and income.
a. Draw the demand curve for organic carrots when PC = 5 and I = 10.
b. Using the demand curve drawn in (a), what is the quantity demanded of organic carrots when PO = 10?
c. Using the demand curve drawn in (a), what is the quantity demanded of organic carrots when PO = 5?
d. Now, suppose PO = 10 and PC = 15 (I remains at 10). What is the quantity demanded of organic car-
rots? Compared with your answer in (b), has there been a change in demand or quantity demanded?
Demonstrate using a graph.
e. What happens to the demand for organic carrots when the price of conventional carrots increases? Are
organic and conventional carrots complements or substitutes?
f. What happens to the demand for organic carrots when the average consumer income increases? Are
carrots a normal or an inferior good?
Solution
2. a. The demand curve for organic carrots when
PC = 5 and I = 10 becomes
Price
($/unit)
20 [2EOCUN01 goes
QD
O = 75 – 5PO + 5 + (2 × 10) = 100 – 5PO
here; 2EOC01]
In other words,
5PO = 100 – QD
O
PO = 20 – _1 QD
5 O
b. For PO = 10, the quantity demanded is D
QD
O = 100 – (5 × 10) = 50 0 100
c. When PO = 5, the quantity demanded of or- Quantity of organic carrots
ganic carrots is
QD
O = 100 – (5 × 5) = 75
d. Suppose PO = 10 and PC = 15, and I = 10; then
QD
O = 75 – 5PO + 15 + (2 × 10) = 75 – (5 × 10) + 15 + (2 × 10) = 60
,2 Part 1 Basic Concepts
Thus, there has been a change in the quantity Price
demanded due to the change in the price of con- ($/unit)
ventional carrots, which leads to an outward shift 22
20
in the demand curve for organic carrots. The new
function represented by D 2 is
QDO = 75 – 5PO + 15 + (2 × 10) = 110 – 5PO
10
→ PO = 22 – _ 1 QD
5 O
e. When the price of conventional carrots increases,
D1 D2
the demand for organic carrots shifts, which leads
to an increase in the quantity demanded for or- 0 50 60 100 110
ganic carrots at the original price. Quantity of organic carrots
f. An increase in income shifts out the demand
curve for organic carrots. Hence, as the average consumer income increases, the quantity demanded of
organic carrots increases. Such an observation is consistent with the definition of a normal good.
3. Out of the following events, which are likely to cause the demand for coffee to increase? Explain your answers.
a. An increase in the price of tea
b. An increase in the price of doughnuts
c. A decrease in the price of coffee
d. The Surgeon General’s announcement that drinking coffee lowers the risk of heart disease
e. Heavy rains causing a record-low coffee harvest in Colombia
Solution
3. a. Since tea and coffee are the classic examples of substitutes, as the price of tea increases, the demand
for coffee is likely to increase.
b. An increase in the price of doughnuts decreases the quantity demanded of doughnuts. Because dough-
nuts and coffee are complements, this will likely decrease the demand for coffee.
c. A decrease in the price of coffee will decrease the quantity demanded of coffee via a movement along
the demand curve.
d. The Surgeon General’s announcement will likely increase the number of people who are interested in
drinking coffee and, thus, increase the demand for coffee.
e. Heavy rain will decrease the supply of coffee. This can be shown as an inward shift of the supply curve.
As a result, the equilibrium price increases and the equilibrium quantity decreases. This adjustment is
accomplished via a movement along the demand curve.
4. How is each of the following events likely to shift the supply curve or the demand curve for fast-food
hamburgers in the United States? Make sure you indicate which curve (curves) is affected and if it shifts
out or in.
a. The price of beef triples.
b. The price of chicken falls by half.
c. The number of teenagers in the economy falls due to population aging.
d. Mad cow disease, a rare but fatal medical condition caused by eating tainted beef, becomes common in
the United States.
e. The Food and Drug Administration publishes a report stating that a certain weight-loss diet, which
encourages the intake of large amounts of meat, is dangerous to one’s health.
f. An inexpensive new grill for home use that makes delicious hamburgers is heavily advertised on television.
g. The dollar rises relative to foreign currencies, so that it becomes expensive for foreign tourists to travel
to the United States on vacation.
h. The minimum wage rises.
Solution
4. a. An increase in the price of beef represents an increase in the cost of an input. This will cause the supply
curve to shift in as the production becomes more expensive.
b. Demand for fast-food hamburgers in the United States will likely shift in since many consumers see
chicken and beef as substitutes. As chicken becomes less expensive, more people will consume chicken and
reduce their consumption of hamburgers, resulting in a decrease in the demand for fast-food hamburgers.
c. The demand curve shifts in.
d. Consumers’ awareness of the mad cow disease shifts the demand for fast-food hamburgers in.
, Supply and Demand Chapter 2
e. Fewer people will follow this diet, causing the demand curve to shift in.
f. As consumers purchase the advertised inexpensive new grill, they are more likely to prepare hamburgers
at home. Given that at-home hamburgers and fast-food hamburgers are likely to be substitutes in the
minds of consumers, the demand for fast-food hamburgers can be expected to shift in.
g. The demand curve shifts in due to a decrease in the number of tourists visiting the United States on
vacation.
h. An increase in the minimum wage increases the supplier’s cost of production, which leads to a decrease
in supply. This is shown as a shifting in of the supply curve.
5. Your roommate remarks that it is strange that a flight from New York to Chicago costs more than a flight
from New York to Orlando, since New York and Chicago are closer than New York and Orlando. What is your
roommate assuming about the relationship between distance and price? How do you explain these prices?
Solution
5. The roommate assumes that the price is directly related to the distance and nothing else. The difference in
prices can be attributed to either differences in supply along the two routes or differences in the demand
for travel along the two routes, or most likely, both.
6. Suppose that a hard freeze destroys a large portion of the Florida orange crop. At the same time, the
Journal of the American Medical Association releases the results of a new study showing that drinking
large quantities of orange juice substantially reduces one’s risks of both heart disease and cancer. What is
the likely effect of these two events on the price of orange juice? On the quantity of orange juice sold?
Solution
6. The hard freeze causes the supply curve to shift in.
On the other hand, the information released by the
Price
($/unit)
S2
S1
Journal of the American Medical Association
shifts the demand curve out. E2
In this particular scenario, both events will tend P2
to increase the price of orange juice, assuming that
the supply and demand curves are not special cases P1 E1
in terms of elasticity. Yet, the effect on quantity
of orange juice sold is ambiguous as it depends on D1 D2
the magnitude of the shifts in the two curves.
Q1 = Q 2 Quantity of
orange juice
7. Suppose that you have been collecting vintage lightning rods for the past 30 years. When you began, find-
ing lightning rods for sale meant drifting from town to town and antique store to antique store hoping that
you would find a lightning rod for sale. The availability made possible by the Internet now means that you
can easily find hundreds of lightning rods for sale at any given time.
a. Draw a diagram showing how the invention and popularization of the Internet have caused the demand
curve for lightning rods to shift.
b. Suppose that the only change in the market for lightning rods is the change you described in (a). How
would that change affect the equilibrium price of lightning rods and the equilibrium quantity of light-
ning rods sold?
Solution
7. a. The invention and popularization of the Inter-
net have caused an increase in the demand for
Price
($/rod)
lightning rods.
D1 D2
Quantity of
lightning rods
, 4 Part 1 Basic Concepts
b. Assuming the supply curve is fixed and not Price S2
a special case in terms of elasticity (as de- ($/rod)
picted below), then the equilibrium price of
lightning rods and the equilibrium quantity S1
will increase. E2
P2
P1 E1
D1
D2
Q2 Q1 Quantity of
lightning rods
Price
8. In March 2002 the retail price of gasoline was ($/barrel) S1990
$1.19 per gallon — exactly the same as it was in
August 1990. Yet, total gasoline production and
consumption rose from 6.6 million barrels per
week in 1990 to 8.7 million barrels per week in $1.19
2002. Using the graph below, draw the appro-
priate shifts in the demand and supply curves to D1990
explain these two phenomena.
0 6.6 Millions of
Solution
8. As stated in the problem, the total consumption
as well as the production of gasoline increased.
Price
barrels/week
S1
($/gallon)
So both supply and demand increase. Shifts are
S2
such that the equilibrium price remains constant
but the equilibrium quantity increases from
6.6 million to 8.7 million, that is, the horizontal E1 E2
price line $1.19 goes through the old and new 1.19
equilibrium points.
D1 D2
0 Q1 Q2 Quantity of
gasoline
9. When the demand for toilet paper increases, the equilibrium quantity sold increases. Consumers are
buying more, and producers are producing more.
a. How do producers receive the signal that they need to increase production to meet the new demand?
b. Does the increased production reflect an increase in supply, or an increase in the quantity supplied?
Explain your answer, referring to (a).
Solution
9. a. Producers independently decide how much to produce of their products given the price at which they
expect to be able to sell them, and consumers show up at stores to buy the good. Sometimes producers
might supply too little in the short run, but through the market, these mistakes tend to be corrected.
The signals producers receive are price signals since shortages or surpluses in the market tend to put
upward or downward pressure on the market price of a good.
b. In this scenario, the increased production reflects an increase in the quantity supplied, not in supply.
An increase in the demand for toilet paper will shift out the demand curve, which will increase the price
of toilet paper and hence the quantity supplied via a movement along the supply curve.
10. Suppose the demand for towels is given by Q D = 100 – 5P, and the supply of towels is given by Q S = 10P.
a. Derive and graph the inverse supply and inverse demand curves.
b. Solve for the equilibrium price and quantity.
c. Suppose that supply changes so that at each price, 20 fewer towels are offered for sale. Derive and graph
the new inverse supply curve.
d. Solve for the new equilibrium price and quantity.