MAT232 Week 4 Assignment 2023 | Statistical Literacy
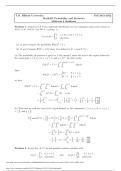
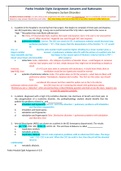
MAT232 Week 4 Assignment 2023 | Statistical Literacy. Use the normal distribution of IQ scores, which has a mean of and a standard deviation of , and the following table with the standard scores and percentiles for a normal distribution to find the indicated quantity. 110 12 Click the icon to view the table. 1 Percentage of scores less than 122 is 84.13 %. (Round to two decimal places as needed.) Standard Scores and Percentiles for a Normal Distribution (cumulative values from the left) Full data set Standard score % Standard score % − 3.0 0.13 0.1 53.98 − 2.5 0.62 0.5 69.15 − 2 2.28 0.9 81.59 − 1.5 6.68 1 84.13 − 1 15.87 1.5 93.32 − 0.9 18.41 2 97.72 − 0.5 30.85 2.5 99.38 − 0.1 46.02 3 99.87 0 50.00 3.5 99.98 3/4/2021 Week 4 - Assignment4/11 8. 2: Data Table Use the normal distribution of heights of adult women, which has a mean of centimeters and a standard deviation of centimeters and the following table with the standard scores and percentiles for a normal distribution to find the indicated quantity. 161 6 Click the icon to view the table. 2 The percentage of heights greater than 164 centimeters is 30.85 %. (Round to two decimal places as needed.) Standard Scores and Percentiles for a Normal Distribution (cumulative values from the left) Full data set Standard score % Standard score % − 3.0 0.13 0.1 53.98 − 2.5 0.62 0.5 69.15 − 2 2.28 0.9 81.59 − 1.5 6.68 1 84.13 − 1 15.87 1.5 93.32 − 0.9 18.41 2 97.72 − 0.5 30.85 2.5 99.38 − 0.1 46.02 3 99.87 0 50.00 3.5 99.98 YOU ANSWERED: 53.98 3/4/2021 Week 4 - Assignment5/11 9. 3: Data Table Based on data from a college, scores on a certain test are normally distributed with a mean of and a standard deviation of . 1523 326 Click the icon to view the table with standard scores and percentiles for a normal distribution. 3 a. Find the percentage of scores greater than 2338. 34.46 % (Round to two decimal places as needed.) b. Find the percentage of scores less than 871. % (Round to two decimal places as needed.) c. Find the percentage of scores between 1360 and 1686. % (Round to two decimal places as needed.) Full data set Standard Scores and Percentiles for a Normal Distribution (cumulative values from the left) Standard score % Standard score % − 3.0 0.13 0.1 53.98 − 2.5 0.62 0.5 69.15 − 2 2.28 0.9 81.59 − 1.5 6.68 1 84.13 − 1 15.87 1.5 93.32 − 0.9 18.41 2 97.72 − 0.5 30.85 2.5 99.38 − 0.1 46.02 3 99.87 0 50.00 3.5 99.98 3/4/2021 Week 4 - Assignment6/11 10. IQ scores are normally distributed with a mean of and a standard deviation of . Assume that many samples of size n are taken from a large population of people and the mean IQ score is computed for each sample. 105 18 a. If the sample size is n = 36 , find the mean and standard deviation of the distribution of sample means. The mean of the distribution of sample means is 105 . The standard deviation of the distribution of sample means is 3.0 . (Type an integer or decimal rounded to the nearest tenth as needed.) b. If the sample size is n = 169 , find the mean and standard deviation of the distribution of sample means. The mean of the distribution of sample means is 105 . The standard deviation of the distribution of sample means is 1.4 . (Type an integer or decimal rounded to the nearest tenth as needed.) c. Why is the standard deviation in part a different from the standard deviation in part b? Choose the correct answer below. A. With smaller sample sizes (as in part a), the means tend to be closer together, so they have less variation, which results in a smaller standard deviation. B. With larger sample sizes (as in part b), the means tend to be further apart, so they have more variation, which results in a bigger standard deviation. C. With smaller sample sizes (as in part a), the means tend to be further apart, so they have more variation, which results in a smaller standard deviation. D. With larger sample sizes (as in part b), the means tend to be closer together, so they have less variation, which results in a smaller standard deviation. YOU ANSWERED:2.61 2.6 3/4/2021 Week 4 - Assignment7/11 11. 4: Standard Normal Distribution Table (Page 1) The ages of commercial aircraft are normally distributed with a mean of years and a standard deviation of years. What percentage of individual aircraft have ages between years and years? Assume that a random sample of aircraft is selected and the mean age of the sample is computed. What percentage of sample means have ages between years and years? 13.5 6.8186 10 15 100 10 15 Click here to view page 1 of the standard normal distribution.4 Click here to view page 2 of the standard normal distribution.5 The percentage of individual aircraft that have ages between 10 years and 15 y
Escuela, estudio y materia
- Institución
-
Ashford University
- Grado
-
MAT 232 (MAT232)
Información del documento
- Subido en
- 13 de febrero de 2023
- Número de páginas
- 12
- Escrito en
- 2022/2023
- Tipo
- Examen
- Contiene
- Preguntas y respuestas
Temas
- mat 232
- mat
- statistical literacy
-
mat232 week 4 assignment review 2023
-
mat232 week 4 assignment review
-
mat232 week 4 assignment statistical literacy
Documento también disponible en un lote