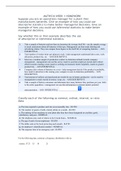
MATH 534 Week 1 Homework Problems
1. Question: Suppose you are an operations manager for a plant that manufactures batteries. Give an example of how you could use descriptive statistics to make better managerial decisions. Give an example of how you could use inferential statistics to make better managerial decisions.Say whether this or that example describes the use of descriptive or inferential statistics. 2. Question: Classify each of the following as nominal, ordinal, interval, or ratio data. 3. Question: For the following data, construct a frequency distribution with six classes. 4. Question: A small portion or a subset of the population on which data is collected for conducting statistical analysis is called: 5. Question: Researchers want to investigate the relationship between the voters’ income level and their voting tendencies in the United States. They took a random sample from each state and asked them about their tendency of voting. What is the population in this problem? 6. Question: Researchers often wish to measure consumers' satisfaction toward certain products and might ask consumers to specify their feelings as either "very dissatisfied," "somewhat dissatisfied," "somewhat satisfied," or "very satisfied." This is an example of what level of data? 7. Question: Given a small dataset: 2.3, 7.1, 6.3, 5.8, 4.2, what is the range for this data? 8. Question: For the following frequency distribution, what is the relative frequency for the class “30-under 40”? 9. Question: Relative frequency for an individual class is the _____ . 10. Question: A frequency table about degrees of 40 CEOs was given. What is the relative frequency of CEOs with PhD degrees? 11. Question: Assuming that the dataset 22, 5, -7, 11, 2, 11 is a sample, what is the sample standard deviation? 12. Question: If the z-score of an observation in a set of normally distributed numerical data is bigger than zero, it means that the observation is . 13. Question: Scores obtained by students in an advanced placement test has a symmetric mound shaped (bell shaped) distribution with a mean of 70 and a standard deviation of 10. What is the proportion of students who received between 60 and 80 points. 14. Question: A population is normally distributed with a mean of 25 and a standard deviation of 3. What is the z score for 18?
Escuela, estudio y materia
- Institución
-
Devry University
- Grado
-
MATH 534 (MATH534)
Información del documento
- Subido en
- 17 de enero de 2023
- Número de páginas
- 7
- Escrito en
- 2022/2023
- Tipo
- OTRO
- Personaje
- Desconocido
Temas
- math 534 week 1 homework
- math 534 week 1
- math 534 homework
- math 534
- math534
-
math 534 week 1 homework problems
Documento también disponible en un lote