I'm here instructor for the laboratory portion of this course. I'm so excited for this opportunity to
practically apply the information that you've learned in the modules for this first lab, lab one, we'll
be taking mass and volume measurements.
By the end of this experiment, we will have compared the accuracy and precision of five
different measurement tools, specifically measuring volume. We will determine the volume of
unknown metal cylinders using two different methods, and we will also compare the
experimentally determined densities of these cylinders with the accepted densities.
In order to assess our accuracy and this task, we
will call to mind 2 concepts that you learned about in the module:
density and the concepts of accuracy and Precision. We will then introduce 2 new concepts that
have average and standard deviation along with percent error so that we can assess how well
we did in our task to begin.
,A quick review on the concept of density:
Density is defined as the
ratio of the mass of the sample of the substance to its volume, and for some solids, we use the
density unit of kilograms per cubic meter. However, in this experiment we'll be using the density
unit of grams per centimeter cubed and grams per millimeter as we.The current and density of
both solids and liquids.
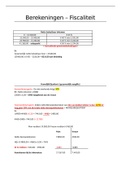
Here on the screen you'll see the three different forms of the density equation.
To calculate density, it is equal to the mass divided by the volume. If we want to calculate for the
mass, we will use the different form of the equation density times volume. And finally if we want
to Cal.The volume, as we will in Part 1 of this experiment, we do so by dividing the mass by the
density.
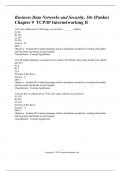
Here on the screen, you're going to see four different targets.
, Each of these targets represents the concept of accuracy and precision somewhat differently.
In the top, left-hand image, we see that this represents low accuracy and low precision. In this
image we are saying that to be accurate means to hit your intended target each and every time.
As you can see on this top left image, the target is only hit once in the center. In describing
precision, you're going to refer to the idea that we can reproduce the result. As you can see in
this image, the results all tend to be scattered about in a random pattern, none of these shots
really being reproduced as none of them are very close to one another.
Now let's take a look at the bottom left image. Here in this image represents high accuracy and
low precision. High accuracy because they all tend to be scattered about the center mass of the
target. However, we would say that these are not precise because of how far apart each of
these measurements is from the other.In the top right hand image, we have a representation of
low accuracy and high precision. This is like being really good at being really bad at something.
As you can see, all of these shots are grouped together quite nicely in the top left-hand corner.
However, none of them are close to the intended point (the center of the target). Finally, in the
bottom, we have both high accuracy and high precision. Not only do all of these shots impact at
the center of the target, but they're also very close to one another.
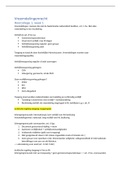
To analyze our success in today's lab, we'll be using these two methods.
, The first method is calculating the mean of our data samples. The mean is computed by dividing
the sum of the values by the number of values. This is sometimes referred to as the arithmetic
mean, and probably a standard practice that you're used to.
The bottom 1 is a little bit more complex. This is called the standard deviation. The standard
deviation is a number that measures how far the data values are from average value Average
value for the arithmetic mean, and we're going to practice calculating this a few times together.
The standard deviation is equal to the sum of the difference between the measured value and
the mean squared divided by the number of measurements in the sample -1.
Finally we'll use percent error to determine how accurate our results are.
the percent error is found by taking the absolute value of the error or the difference between the
experiment Is found by taking the absolute value of the error or the difference between the
experimental value and the accepted values, and then you divide this by the accepted value and
multiply by a factor of 100% to turn a decimal into a percentage.
This experiment is going to consist of two main parts.
practically apply the information that you've learned in the modules for this first lab, lab one, we'll
be taking mass and volume measurements.
By the end of this experiment, we will have compared the accuracy and precision of five
different measurement tools, specifically measuring volume. We will determine the volume of
unknown metal cylinders using two different methods, and we will also compare the
experimentally determined densities of these cylinders with the accepted densities.
In order to assess our accuracy and this task, we
will call to mind 2 concepts that you learned about in the module:
density and the concepts of accuracy and Precision. We will then introduce 2 new concepts that
have average and standard deviation along with percent error so that we can assess how well
we did in our task to begin.
,A quick review on the concept of density:
Density is defined as the
ratio of the mass of the sample of the substance to its volume, and for some solids, we use the
density unit of kilograms per cubic meter. However, in this experiment we'll be using the density
unit of grams per centimeter cubed and grams per millimeter as we.The current and density of
both solids and liquids.
Here on the screen you'll see the three different forms of the density equation.
To calculate density, it is equal to the mass divided by the volume. If we want to calculate for the
mass, we will use the different form of the equation density times volume. And finally if we want
to Cal.The volume, as we will in Part 1 of this experiment, we do so by dividing the mass by the
density.
Here on the screen, you're going to see four different targets.
, Each of these targets represents the concept of accuracy and precision somewhat differently.
In the top, left-hand image, we see that this represents low accuracy and low precision. In this
image we are saying that to be accurate means to hit your intended target each and every time.
As you can see on this top left image, the target is only hit once in the center. In describing
precision, you're going to refer to the idea that we can reproduce the result. As you can see in
this image, the results all tend to be scattered about in a random pattern, none of these shots
really being reproduced as none of them are very close to one another.
Now let's take a look at the bottom left image. Here in this image represents high accuracy and
low precision. High accuracy because they all tend to be scattered about the center mass of the
target. However, we would say that these are not precise because of how far apart each of
these measurements is from the other.In the top right hand image, we have a representation of
low accuracy and high precision. This is like being really good at being really bad at something.
As you can see, all of these shots are grouped together quite nicely in the top left-hand corner.
However, none of them are close to the intended point (the center of the target). Finally, in the
bottom, we have both high accuracy and high precision. Not only do all of these shots impact at
the center of the target, but they're also very close to one another.
To analyze our success in today's lab, we'll be using these two methods.
, The first method is calculating the mean of our data samples. The mean is computed by dividing
the sum of the values by the number of values. This is sometimes referred to as the arithmetic
mean, and probably a standard practice that you're used to.
The bottom 1 is a little bit more complex. This is called the standard deviation. The standard
deviation is a number that measures how far the data values are from average value Average
value for the arithmetic mean, and we're going to practice calculating this a few times together.
The standard deviation is equal to the sum of the difference between the measured value and
the mean squared divided by the number of measurements in the sample -1.
Finally we'll use percent error to determine how accurate our results are.
the percent error is found by taking the absolute value of the error or the difference between the
experiment Is found by taking the absolute value of the error or the difference between the
experimental value and the accepted values, and then you divide this by the accepted value and
multiply by a factor of 100% to turn a decimal into a percentage.
This experiment is going to consist of two main parts.