Strategic Management
Chapter 1: What is strategy?
introduction
The determina on of long-run goals and objec ves of an enterprise and the adop on of courses of
ac on and the alloca on of resources necessary for carrying out these goals” - Chandler A., Strategy
and Structure, MIT press, 1962
Successful strategy
1. Clear and consistent long-term goals: This is the company’s vision or reason for existence. It
means se ng clear and realis c goals for the future.
2. Good understanding of the compe ve environment: A company is not alone. It’s important
to know how the industry works: who are the compe tors, how do they compete, what
makes the industry profitable, and how is the market changing over me.
3. Building and using resources and capabili es for compe ve advantage: To be successful, a
company needs something special that others don’t have. This could be a be er product that
meets customer needs or the ability to produce cheaper to offer lower prices. These unique
strengths create a compe ve advantage.
4. Effec ve implementa on: A strategy is not just a plan on paper. It must be put into ac on:
hiring the right people, organizing the company well, and crea ng systems and a culture that
support the goals.
5. Strategic fit between goals, environment, resources, and implementa on: All parts must fit
well together. Goals should match the market condi ons, the compe ve advantage should
fit how companies compete in that industry, and the way the strategy is executed must
support everything
Clear and consistent long-term goals
Long-term goals are a company’s vision and mission — why the company exists and what it wants to
achieve in the future. To achieve their long-term goals, companies want to maximize their value
crea on. Maximizing value crea on involves improving three key drivers that shape long-term goals.
Universally, enhancing these three drivers is essen al for any company striving to be successful.
1. Sales growth: increasing the number of units sold
2. Sales margin: raising the profit earned on each product
3. Capital turnover and resource u liza on: measuring how efficiently a company uses its
invested capital, calculated by dividing sales by the amount of capital invested. In other
words, it shows how many dollars in sales are generated per dollar invested.
Improving the drivers
A CEO tries to improve these three drivers by:
o Crea ng be er products to sell more (increase sales growth).
o Lowering costs without hur ng quality (increase profit margin).
o Using capital more efficiently to generate more sales (improve capital turnover).
,The example of IBM
There was a company that was the first to sell large mainframe computers and then desktop
computers. They were very successful at first. But later:
Other companies, especially from China, started making cheaper computers with similar
performance.
It became hard to stand out because computers were very similar.
Compe on shi ed to price instead of unique features.
So, the company changed its strategy to focus more on so ware instead of hardware,
because so ware had higher profits and be er growth poten al.
Example: McDonald’s
McDonald’s focuses mainly on: Selling more in exis ng restaurants (increase sales growth).
They don’t want to open too many new restaurants because that needs a lot of investment.
This keeps the capital turnover high. (Sales growth & capital turnover)
They don’t focus much on increasing profit margin by raising prices or lowering costs
because: Raising prices might make customers go to Burger King instead and lowering costs is
very hard because they already operate very efficiently at huge scale.
Not every company focuses on all three drivers at the same me. Depending on the industry and
situa on, it can be smart to focus on one or two drivers.
Good understanding of the competitive environment
To create a successful long-term strategy, a company needs a deep understanding of its compe ve
environment — specifically, the factors that determine the profitability of the industry it operates in.
These factors can be both posi ve and nega ve and shape how a rac ve or challenging the industry
is for genera ng profits. Corpora ons analyze these determinants using strategic frameworks such
as:
PEST Analysis (Poli cal, Economic, Social, Technological) — which examines the broader
macro-environmental factors impac ng the industry.
Porter’s Five Forces — which focuses on the microenvironment, iden fying five key forces
that influence industry profitability and compe ve intensity.
Porter’s Five Forces Explained
Porter’s Five Forces model helps assess the compe ve pressures within an industry that affect
overall profitability:
1. Industry Rivalry: The intensity of
compe on among exis ng
firms. High rivalry usually drives
prices down and reduces profits.
Rivalry is o en based on price,
quality, or marke ng.
2. Buyer Power: Customers’ ability to nego ate be er prices or demand higher quality/services.
When buyers have many alterna ves, their bargaining power is strong, which lowers industry
profitability.
, 3. Supplier Power: Suppliers can affect profitability by charging higher prices or limi ng quality.
When there are few suppliers or unique inputs, supplier power increases, squeezing profit
margins.
4. Threat of New Entrants: If it is easy for new compe tors to enter the industry, exis ng firms
face pressure to keep prices low and innovate, reducing profitability. Barriers such as high
capital requirements, patents, or regula ons can protect incumbents.
5. Threat of Subs tutes: Products from outside the industry that fulfill the same customer need
(e.g., bikes as a subs tute for cars). The presence of a rac ve subs tutes limits the ability to
raise prices.
Profitability is not just about direct compe on; it also depends on how much power buyers and
suppliers have and how easily new firms can enter or subs tutes can replace your product. Industries
differ widely in profitability because of the unique balance of these forces.
Example: Tobacco vs. Airline Industry Profitability
Tobacco Industry
Buyer power is low due to addic on and price inelas city; customers con nue buying despite
price increases.
Supplier power is low because tobacco farmers have many alterna ves and low bargaining
power.
Industry rivalry is low as a few companies dominate many brands, reducing compe on.
Threat of subs tutes is low because of strong brand loyalty and few alterna ves.
High barriers to entry exist due to heavy regula ons, brand loyalty, and adver sing
restric ons.
Airline Industry
High industry rivalry with many compe tors figh ng mostly on price.
High supplier power from aircra manufacturers (Boeing, Airbus), airports, and fuel suppliers,
all of which have significant control over costs.
High buyer power since customers can easily compare prices and switch airlines.
Moderate threat of new entrants, as leasing planes and small routes allow new compe tors
to enter.
Threat of subs tutes exists but is limited (e.g., trains or cars for short distances).
Building and using resources and capabilities to achieve objectives to develop competitive
advantage
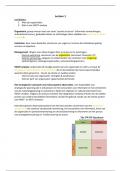
Price and Willingness to Pay (WTP)
Willingness to Pay (WTP): the maximum price a consumer is willing to pay
for a product or service. It reflects how much value the consumer a aches
to the product. & Price (P): the actual amount charged by the company. 3
possible situa ons:
1. P = WTP → the consumer is indifferent. They see no surplus in
buying, so they are “just on the edge” of purchase.
2. P < WTP → the consumer gains consumer surplus (they feel they
got a good deal).
3. P > WTP → the consumer will not buy, because the product is too expensive compared to
perceived value.
, Consumer decision-making therefore depends not only on the price, but also on how the company
can raise WTP through quality, branding, or differen a on.
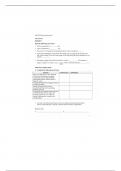
Value Crea on and Value Capture
Looking at the second diagram:
Value Crea on = WTP – Cost
o This is the total amount of value generated by the transac on.
o It benefits both the consumer (consumer surplus) and the company (profit).
Value Capture by the Company = Price – Cost
o This is the profit margin per unit.
Value Capture by the Consumer = WTP – Price
o This is the consumer surplus (the value they get beyond what they pay).
Examples:
Airlines: Flying is highly valuable (WTP is high), but due to compe on prices are low →
consumers capture more value, companies capture less.
Luxury goods: O en companies capture a large share of the value through high prices.
The challenge for companies is not only to create value but also to capture a significant part of it.
two main ways to create more value:
1. Develop a Be er Product or Service: You
can increase the value of your offering by
be er understanding your customers’ needs:
Iden fy their real problems and pain
points.
Design your product or service in a
way that solves those problems more
effec vely.
This could mean a be er user
experience, be er quality, or greater
convenience.
If you succeed in crea ng more value for your customers, their willingness to pay increases — which
allows you to charge a higher price and capture more value.
2. Decrease Your Average Cost: The second approach is to improve your efficiency — that is, to lower
your average cost.Your average cost equals your total opera ng cost divided by the number of units
sold. Why is that important? Because reducing your average cost increases your profit margin and
compe veness.You can lower average costs in several ways:
Economies of scale: If you produce and sell more units, your fixed costs are spread over more
sales, reducing the average cost.
Pricing strategy: If your customers are price-sensi ve (high price elas city of demand),
lowering your price might increase sales volume. If higher sales lead to economies of scale,
your average cost drops — poten ally making the lower price profitable in the long run.
Opera onal efficiency: Streamline produc on, logis cs, and other opera ons to reduce
waste and cost per unit.
Chapter 1: What is strategy?
introduction
The determina on of long-run goals and objec ves of an enterprise and the adop on of courses of
ac on and the alloca on of resources necessary for carrying out these goals” - Chandler A., Strategy
and Structure, MIT press, 1962
Successful strategy
1. Clear and consistent long-term goals: This is the company’s vision or reason for existence. It
means se ng clear and realis c goals for the future.
2. Good understanding of the compe ve environment: A company is not alone. It’s important
to know how the industry works: who are the compe tors, how do they compete, what
makes the industry profitable, and how is the market changing over me.
3. Building and using resources and capabili es for compe ve advantage: To be successful, a
company needs something special that others don’t have. This could be a be er product that
meets customer needs or the ability to produce cheaper to offer lower prices. These unique
strengths create a compe ve advantage.
4. Effec ve implementa on: A strategy is not just a plan on paper. It must be put into ac on:
hiring the right people, organizing the company well, and crea ng systems and a culture that
support the goals.
5. Strategic fit between goals, environment, resources, and implementa on: All parts must fit
well together. Goals should match the market condi ons, the compe ve advantage should
fit how companies compete in that industry, and the way the strategy is executed must
support everything
Clear and consistent long-term goals
Long-term goals are a company’s vision and mission — why the company exists and what it wants to
achieve in the future. To achieve their long-term goals, companies want to maximize their value
crea on. Maximizing value crea on involves improving three key drivers that shape long-term goals.
Universally, enhancing these three drivers is essen al for any company striving to be successful.
1. Sales growth: increasing the number of units sold
2. Sales margin: raising the profit earned on each product
3. Capital turnover and resource u liza on: measuring how efficiently a company uses its
invested capital, calculated by dividing sales by the amount of capital invested. In other
words, it shows how many dollars in sales are generated per dollar invested.
Improving the drivers
A CEO tries to improve these three drivers by:
o Crea ng be er products to sell more (increase sales growth).
o Lowering costs without hur ng quality (increase profit margin).
o Using capital more efficiently to generate more sales (improve capital turnover).
,The example of IBM
There was a company that was the first to sell large mainframe computers and then desktop
computers. They were very successful at first. But later:
Other companies, especially from China, started making cheaper computers with similar
performance.
It became hard to stand out because computers were very similar.
Compe on shi ed to price instead of unique features.
So, the company changed its strategy to focus more on so ware instead of hardware,
because so ware had higher profits and be er growth poten al.
Example: McDonald’s
McDonald’s focuses mainly on: Selling more in exis ng restaurants (increase sales growth).
They don’t want to open too many new restaurants because that needs a lot of investment.
This keeps the capital turnover high. (Sales growth & capital turnover)
They don’t focus much on increasing profit margin by raising prices or lowering costs
because: Raising prices might make customers go to Burger King instead and lowering costs is
very hard because they already operate very efficiently at huge scale.
Not every company focuses on all three drivers at the same me. Depending on the industry and
situa on, it can be smart to focus on one or two drivers.
Good understanding of the competitive environment
To create a successful long-term strategy, a company needs a deep understanding of its compe ve
environment — specifically, the factors that determine the profitability of the industry it operates in.
These factors can be both posi ve and nega ve and shape how a rac ve or challenging the industry
is for genera ng profits. Corpora ons analyze these determinants using strategic frameworks such
as:
PEST Analysis (Poli cal, Economic, Social, Technological) — which examines the broader
macro-environmental factors impac ng the industry.
Porter’s Five Forces — which focuses on the microenvironment, iden fying five key forces
that influence industry profitability and compe ve intensity.
Porter’s Five Forces Explained
Porter’s Five Forces model helps assess the compe ve pressures within an industry that affect
overall profitability:
1. Industry Rivalry: The intensity of
compe on among exis ng
firms. High rivalry usually drives
prices down and reduces profits.
Rivalry is o en based on price,
quality, or marke ng.
2. Buyer Power: Customers’ ability to nego ate be er prices or demand higher quality/services.
When buyers have many alterna ves, their bargaining power is strong, which lowers industry
profitability.
, 3. Supplier Power: Suppliers can affect profitability by charging higher prices or limi ng quality.
When there are few suppliers or unique inputs, supplier power increases, squeezing profit
margins.
4. Threat of New Entrants: If it is easy for new compe tors to enter the industry, exis ng firms
face pressure to keep prices low and innovate, reducing profitability. Barriers such as high
capital requirements, patents, or regula ons can protect incumbents.
5. Threat of Subs tutes: Products from outside the industry that fulfill the same customer need
(e.g., bikes as a subs tute for cars). The presence of a rac ve subs tutes limits the ability to
raise prices.
Profitability is not just about direct compe on; it also depends on how much power buyers and
suppliers have and how easily new firms can enter or subs tutes can replace your product. Industries
differ widely in profitability because of the unique balance of these forces.
Example: Tobacco vs. Airline Industry Profitability
Tobacco Industry
Buyer power is low due to addic on and price inelas city; customers con nue buying despite
price increases.
Supplier power is low because tobacco farmers have many alterna ves and low bargaining
power.
Industry rivalry is low as a few companies dominate many brands, reducing compe on.
Threat of subs tutes is low because of strong brand loyalty and few alterna ves.
High barriers to entry exist due to heavy regula ons, brand loyalty, and adver sing
restric ons.
Airline Industry
High industry rivalry with many compe tors figh ng mostly on price.
High supplier power from aircra manufacturers (Boeing, Airbus), airports, and fuel suppliers,
all of which have significant control over costs.
High buyer power since customers can easily compare prices and switch airlines.
Moderate threat of new entrants, as leasing planes and small routes allow new compe tors
to enter.
Threat of subs tutes exists but is limited (e.g., trains or cars for short distances).
Building and using resources and capabilities to achieve objectives to develop competitive
advantage
Price and Willingness to Pay (WTP)
Willingness to Pay (WTP): the maximum price a consumer is willing to pay
for a product or service. It reflects how much value the consumer a aches
to the product. & Price (P): the actual amount charged by the company. 3
possible situa ons:
1. P = WTP → the consumer is indifferent. They see no surplus in
buying, so they are “just on the edge” of purchase.
2. P < WTP → the consumer gains consumer surplus (they feel they
got a good deal).
3. P > WTP → the consumer will not buy, because the product is too expensive compared to
perceived value.
, Consumer decision-making therefore depends not only on the price, but also on how the company
can raise WTP through quality, branding, or differen a on.
Value Crea on and Value Capture
Looking at the second diagram:
Value Crea on = WTP – Cost
o This is the total amount of value generated by the transac on.
o It benefits both the consumer (consumer surplus) and the company (profit).
Value Capture by the Company = Price – Cost
o This is the profit margin per unit.
Value Capture by the Consumer = WTP – Price
o This is the consumer surplus (the value they get beyond what they pay).
Examples:
Airlines: Flying is highly valuable (WTP is high), but due to compe on prices are low →
consumers capture more value, companies capture less.
Luxury goods: O en companies capture a large share of the value through high prices.
The challenge for companies is not only to create value but also to capture a significant part of it.
two main ways to create more value:
1. Develop a Be er Product or Service: You
can increase the value of your offering by
be er understanding your customers’ needs:
Iden fy their real problems and pain
points.
Design your product or service in a
way that solves those problems more
effec vely.
This could mean a be er user
experience, be er quality, or greater
convenience.
If you succeed in crea ng more value for your customers, their willingness to pay increases — which
allows you to charge a higher price and capture more value.
2. Decrease Your Average Cost: The second approach is to improve your efficiency — that is, to lower
your average cost.Your average cost equals your total opera ng cost divided by the number of units
sold. Why is that important? Because reducing your average cost increases your profit margin and
compe veness.You can lower average costs in several ways:
Economies of scale: If you produce and sell more units, your fixed costs are spread over more
sales, reducing the average cost.
Pricing strategy: If your customers are price-sensi ve (high price elas city of demand),
lowering your price might increase sales volume. If higher sales lead to economies of scale,
your average cost drops — poten ally making the lower price profitable in the long run.
Opera onal efficiency: Streamline produc on, logis cs, and other opera ons to reduce
waste and cost per unit.