Summary Introduction to Research in Marketing
Lecture 1 à introduction, data exploration & visualization
Statistical tests
Statistical tests exist to support strategic and tactical decisions like segmentation, targeting,
positioning, etc.
- What types of shoppers can we distinguish and how can we optimally market our
products to them?
- What is our brand image relative to our competitors?
This is important because almost every real-life marketing problem requires statistical
analysis.
Multivariate analysis
Multivariate analysis à refers to all statistical methods that analyse multiple measurements
on each object under investigations:
- Dependence techniques à One or more variables can be identified as dependent
variables and the remaining as independent variables.
The choice of dependence technique depends on the number of dependent
variables. You are looking for cause and effect relationships.
Logistic regression, conjoint analysis
- Interdependence techniques à for a large number of measures.
Factor analysis, cluster analysis
Review: measurement, sampling and statistical testing
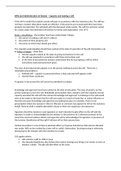
Total error framework
What you don’t observe when you are collecting data
are the errors. This could be:
- Sampling error à who I ask
- Measurement error à how I ask
- Statistical error à how I analyse
If you mess up any of these, your results will be
biased, and your recommendations will be wrong.
Example
So in the treatment group you see 6.5 and there is an
error of 1.5. So therefore you have a control group.
So it is very important to avoid errors, because
otherwise you will give your manager the wrong
advice based on your data which includes errors.
1
,Sampling
Sampling error à a biased sampling
Problem
- Smartphone adoption means everyone screens their
calls.
- The sample of respondents differs (significantly)
from the population
- Non-response error
To what extent is that 6% who responds different from the
population?
In practice
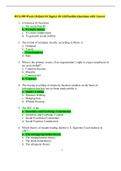
Basically, every survey:
- Sampling
- Adjust using post-stratifcation weights
Make your sample closer to your population by using post-stratification weights
Let’s say your population is 50% female, but your sample is 80% female. So your sample is
biased, because you have much more female in your sample.
2
,The males give an average of 4.2 on buying this brand. And female on average 3.4
A simple average will underestimate males, who in this case like brand Z more than females
(0.2 x 4.2) + (0.8 x 3.4) = 3.56
But our sample is biased, so this is wrong. We need to debias the sample.
In the sample , whereas in the population
Then the weighted average will be closer:
If you want to do a poll in the USA to know who is gonna win, Trump of Bardin. But there are
much more Trump voters who accept the poll, than probably your outcome is that Trump will
win. So your sample is biased, because your sample involves more trump voters in proportion
to the population.
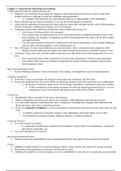
Xbox users to forecast 2012 US presidential election: Obama or…
Knowing that these quatities, knowing that they are more likely to be male, a lot of white
and younger people. We can correct for that. If we have a very good idea about that, we can
have a very good prediction about who is going to win.
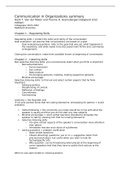
This data shows the characteristics of Xbox users and the population of large. Whether they
voted for Oboma or McCain.
3
, After weighting it shows like this. It shows that doing so is a pretty good prediction who is
going to win that election. We have a clearly biased sample Xbox users more likely to be
male, white and younger. Knowing all this and knowing the characteristics of the population,
we can make pretty good inferences.
So, you use the post-stratisfaction weight to solve this problem
Review measurement scales (à ending up in measurement error)
If you don’t use the right scale, you can’t do the right statistical techniques.
When we talk about measurement scales, we talk about:
- Non-metric scales:
o Nominal (categorical)
o Ordinal
These outcomes can be categorical (labels) or directional – can measure only the
direction of the response (yes/no)
- Metric (continuous) scales:
o Interval
o Ratio
In contrast, when scales are continuous they not only measure direction or
classification, but intensity as well (strongly agree or somewhat agree)
Nominal scale
Nominal à Number serves only as label or tag for identifying or classifying objects in
mutually exclusive (= it is one number, but not another. Not at the same time) and
collectively exhaustive (= at least one) categories. It has no meaning.
SNR, gender
That student number had be another number, but that made no difference.
We all have a student number, we can’t have no student number (= collectively exhaustive),
but we can’t have multiple student numbers (=mutually exclusive).
4
Lecture 1 à introduction, data exploration & visualization
Statistical tests
Statistical tests exist to support strategic and tactical decisions like segmentation, targeting,
positioning, etc.
- What types of shoppers can we distinguish and how can we optimally market our
products to them?
- What is our brand image relative to our competitors?
This is important because almost every real-life marketing problem requires statistical
analysis.
Multivariate analysis
Multivariate analysis à refers to all statistical methods that analyse multiple measurements
on each object under investigations:
- Dependence techniques à One or more variables can be identified as dependent
variables and the remaining as independent variables.
The choice of dependence technique depends on the number of dependent
variables. You are looking for cause and effect relationships.
Logistic regression, conjoint analysis
- Interdependence techniques à for a large number of measures.
Factor analysis, cluster analysis
Review: measurement, sampling and statistical testing
Total error framework
What you don’t observe when you are collecting data
are the errors. This could be:
- Sampling error à who I ask
- Measurement error à how I ask
- Statistical error à how I analyse
If you mess up any of these, your results will be
biased, and your recommendations will be wrong.
Example
So in the treatment group you see 6.5 and there is an
error of 1.5. So therefore you have a control group.
So it is very important to avoid errors, because
otherwise you will give your manager the wrong
advice based on your data which includes errors.
1
,Sampling
Sampling error à a biased sampling
Problem
- Smartphone adoption means everyone screens their
calls.
- The sample of respondents differs (significantly)
from the population
- Non-response error
To what extent is that 6% who responds different from the
population?
In practice
Basically, every survey:
- Sampling
- Adjust using post-stratifcation weights
Make your sample closer to your population by using post-stratification weights
Let’s say your population is 50% female, but your sample is 80% female. So your sample is
biased, because you have much more female in your sample.
2
,The males give an average of 4.2 on buying this brand. And female on average 3.4
A simple average will underestimate males, who in this case like brand Z more than females
(0.2 x 4.2) + (0.8 x 3.4) = 3.56
But our sample is biased, so this is wrong. We need to debias the sample.
In the sample , whereas in the population
Then the weighted average will be closer:
If you want to do a poll in the USA to know who is gonna win, Trump of Bardin. But there are
much more Trump voters who accept the poll, than probably your outcome is that Trump will
win. So your sample is biased, because your sample involves more trump voters in proportion
to the population.
Xbox users to forecast 2012 US presidential election: Obama or…
Knowing that these quatities, knowing that they are more likely to be male, a lot of white
and younger people. We can correct for that. If we have a very good idea about that, we can
have a very good prediction about who is going to win.
This data shows the characteristics of Xbox users and the population of large. Whether they
voted for Oboma or McCain.
3
, After weighting it shows like this. It shows that doing so is a pretty good prediction who is
going to win that election. We have a clearly biased sample Xbox users more likely to be
male, white and younger. Knowing all this and knowing the characteristics of the population,
we can make pretty good inferences.
So, you use the post-stratisfaction weight to solve this problem
Review measurement scales (à ending up in measurement error)
If you don’t use the right scale, you can’t do the right statistical techniques.
When we talk about measurement scales, we talk about:
- Non-metric scales:
o Nominal (categorical)
o Ordinal
These outcomes can be categorical (labels) or directional – can measure only the
direction of the response (yes/no)
- Metric (continuous) scales:
o Interval
o Ratio
In contrast, when scales are continuous they not only measure direction or
classification, but intensity as well (strongly agree or somewhat agree)
Nominal scale
Nominal à Number serves only as label or tag for identifying or classifying objects in
mutually exclusive (= it is one number, but not another. Not at the same time) and
collectively exhaustive (= at least one) categories. It has no meaning.
SNR, gender
That student number had be another number, but that made no difference.
We all have a student number, we can’t have no student number (= collectively exhaustive),
but we can’t have multiple student numbers (=mutually exclusive).
4