Diagram Name / analysis - As-AD
Diagram for circular flow of income.
Diagram Name / analysis - As-AD
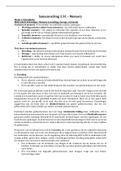
AS-AD; AD shift right
Suppose government spending (G) rises. G is a component of
aggregate demand (AD). So higher G increases AD - AD shifts right
from AD to AD1.
This results in rising real GDP from Y to Y1 and a rising price level
from PL to PL1.
To move to the new equilibrium, there is an extension along the
aggregate supply curve.
Diagram Name / analysis
AS-AD; SRAS shift right
Suppose the prices of raw materials fall. This lowers business costs.
So short-run aggregate supply shifts right from SRAS to SRAS1.
This results in rising real GDP (Y to Y1) and falling price level (PL
to PL1).
To move to the new equilibrium, there is an extension along the AD
curve.
Diagram Name / analysis
AS-AD; LRAS shift right
An improvement in productivity shifts long-run aggregate supply
(LRAS) right from LRAS to LRAS1.
This raises real GDP (from Y to Y1) and lowers the price level from PL
to PL1.
To move to the new equilibrium, there is an extension along the AD
curve.
, 1
Diagram Name / analysis
AS-AD: SRAS and LRAS shift right
An increase in productivity will shift the LRAS as above. It may also
mean lower business costs,
shifting the SRAS to the right as well.
This combines the two previous diagrams.
Diagram Name / analysis
Trend Growth Rate
Diagram Name / analysis
AS-AD: AD shift right plus multiplier
The Multiplier Effect
Adding to the "AD shift right diagram", the multiplier effect causes a
second shift right in aggregate demand from AD1 to AD2.
Higher government spending on construction materials makes the
suppliers richer. This raises incomes of the suppliers' workers, so
those workers spend more in local shops.
● Y to Y1 is the initial government spending (P to P1).
● Y1 to Y2 is the multiplier effect (resulting in P1 to P2).
● Multiplier = Y2 - Y / Y1 - Y
Diagram for circular flow of income.
Diagram Name / analysis - As-AD
AS-AD; AD shift right
Suppose government spending (G) rises. G is a component of
aggregate demand (AD). So higher G increases AD - AD shifts right
from AD to AD1.
This results in rising real GDP from Y to Y1 and a rising price level
from PL to PL1.
To move to the new equilibrium, there is an extension along the
aggregate supply curve.
Diagram Name / analysis
AS-AD; SRAS shift right
Suppose the prices of raw materials fall. This lowers business costs.
So short-run aggregate supply shifts right from SRAS to SRAS1.
This results in rising real GDP (Y to Y1) and falling price level (PL
to PL1).
To move to the new equilibrium, there is an extension along the AD
curve.
Diagram Name / analysis
AS-AD; LRAS shift right
An improvement in productivity shifts long-run aggregate supply
(LRAS) right from LRAS to LRAS1.
This raises real GDP (from Y to Y1) and lowers the price level from PL
to PL1.
To move to the new equilibrium, there is an extension along the AD
curve.
, 1
Diagram Name / analysis
AS-AD: SRAS and LRAS shift right
An increase in productivity will shift the LRAS as above. It may also
mean lower business costs,
shifting the SRAS to the right as well.
This combines the two previous diagrams.
Diagram Name / analysis
Trend Growth Rate
Diagram Name / analysis
AS-AD: AD shift right plus multiplier
The Multiplier Effect
Adding to the "AD shift right diagram", the multiplier effect causes a
second shift right in aggregate demand from AD1 to AD2.
Higher government spending on construction materials makes the
suppliers richer. This raises incomes of the suppliers' workers, so
those workers spend more in local shops.
● Y to Y1 is the initial government spending (P to P1).
● Y1 to Y2 is the multiplier effect (resulting in P1 to P2).
● Multiplier = Y2 - Y / Y1 - Y