Introduction to Statistical Analysis
Chapter 1: Introduction to Statistics
Statistics = the study of how we describe and make inferences from data (Commonly applied to evaluate
scientific observations)
Descriptive statistics = applying statistics to organize and summarize information. Used so other
people can read about it. To make sense or meaning of a list of numeric values.
- Typically presented graphically, in tabular form (tables), or as summary statistics (single values)
- Tables and graphs have the advantage of clarifying findings in a research study
Inferential statistics = allows researchers to infer or generalize observations made with samples to
the larger population from which they were selected.
• Inference = a conclusion reached on the basis of evidence and reasoning
Population = set of all individuals, items, or data of
interest. The group that will be generalized
Population parameter = a characteristic that
describes a population
Sample = set of individuals, items, or data selected
from a population of interest.
Sample statistic = a characteristic that describes a
sample
N = Population size
n = Sample size
The observations researchers make are typically recorded as data; measurements or observations
that are typically numeric. A datum is a single measurement or observation, usually referred to as a
score or raw score.
Structure for making observations:
1. Ask a question
2. Set up a research study
3. Measure behaviour
4. Evaluate findings
Level of measurements (NOIR)
variables
Qualitative
• Nominal = no ranking available
o E.g.: favourite medium, hair colour, nationality, gender, religion
• Ordinal = meaningful ranking/ordering. Distance is unknown
variables
Quantitative
o E.g.: Social class, conservatism, prejudice, preference rankings, market position
• Interval = distance is important
o E.g.: IQ. Fahrenheit (80 degrees is not twice as hot as 40 degrees, because zero is not a total lack of heat),
attitude, opinions
• Ratio = absolute and meaningful zero point (true zero point)
o E.g.: hours of watching tv, age (you can say a person is twice as old as another), sales, income, cost
➔ We always first need to know the level of measurement in order to know which statistical
techniques we may use for the given variable(s).
Unit of analysis = what or whom that is being studied. The unit that you will be able to draw a
conclusion about.
,Variable = a measured property of each of the units of analysis
• Univariate = one variable: ‘what was the average grade if the ISA exam last year?’
• Bivariate = two variables: ‘did males and females differ in their grades?’
• Multivariate = three or more variables: ‘was the grade dependent on the initial motivation,
the time spent on reading and gender’.
Types of variables
Continuous variable = measured along a continuum.
Measured at any place beyond the decimal point. Can thus be measured in fractional units.
But are only measured in whole units or categories
E.g.: 1.0, 2.0, 3.0, etc. But also: 3.14812, 2.7492, and so on.
E.g.: weight, length, time, temperature
Discrete variable = measured in whole units of categories
So, they are not measures along a continuum
E.g.: 1, 2, 3, 4, 5, etc.
E.g.: Sum of two dices, number of students/siblings, amount of change in your pocket
Quantitative variable = by amount, numeric units. Often collected by measuring or counting.
Both continuous and discrete variables can be quantitative
Qualitative variable = varies by class. Often labels for the behaviours we observe
Only discrete variables
,Chapter 3: Summarizing Data
Central tendency = statistical measures for locating a single score that is most representative or
descriptive of all scores in a distribution. Although we lose some meaning anytime we reduce a set
of data to a single score, statistical measures of central tendency ensure that the single score
meaningfully represents a set of data.
1) Mean
2) Median
3) Mode
Measures of central tendency
• Mean (M) = all values are added up and divided by n, which is the number of observations in
the sample. Only to interval and ratio level of measurements. Mostly used for describing
normally distributed variables.
o Population of Mean =
o Sample mean =
o The ‘balance point’ in a distribution
o Characteristics:
✓ Changing any score will change the mean
✓ Adding or removing a score will change the mean (unless that score is already equal to the
mean)
✓ Adding, subtracting, multiplying, dividing each score by a given value (a ‘constant’)
causes the mean to change accordingly
✓ Sum of difference from the mean is zero → 0 = Σ(x – M)
✓ Sum of squared differences from the mean is minimal → = Σ(x – M2)
• Median = the middle value of a distribution
o (1) Sort all cases based on their value x, (2) the order of the ‘middle case’ equals the median
o Whenever n is an even number, the median is the mean value of two middle cases
𝑛+1
▪ Median position = 2
o Only to ordinal / interval ratio level of measurements
o Often used for interval/ratio variables that have skewed distributions
o It is not as sensitive to outliers as the mean
o The median can be estimated by a cumulative percent distribution
• Mode = the category with the largest amount of cases
o Can be used for nominal, ordinal, interval, ratio variables
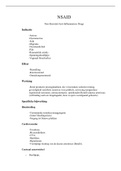
Normal distribution (bell curve) = symmetrical distribution in which scores are similarly distributed
above and belove the mean, the median and the mode at the centre of the distribution.
➔ The mean, median, and mode is the same value
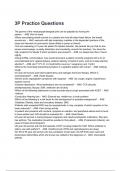
Skewed distribution = a distribution of scores that includes outliers or scores that fall substantially
above or below most other scores in a data set.
Positively skewed distribution = in which the outliers are substantially
larger (toward the right tail in a graph) than most other scores
Negatively skewed distribution = in which outliers are substantially
smaller (toward the left tail in a graph) than most other scores.
Skewed distribution
, Distribution types
❖ Modal distribution => in which one or more scores occur most often or most frequently
❖ Unimodal distribution => in which one score occurs most often or most frequently. Have a
single mode.
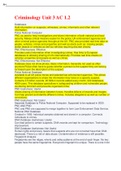
❖ Bimodal distribution => in which two scores occur most often or most frequently. Has two
modes.
Bimodal distribution
❖ Multimodal distribution => in which more than two scores occur most often or most
frequently. It has more than two modes.
❖ Nonmodal distribution (rectangular distribution) => all scores occur at the same frequency. Is has
no mode at all.
Anytime you see phrases such as most often, typical, or common, the mode is being used to describe
these data.
The mode is used to describe nominal data that identify something or someone, nothing more.
Because a nominal scale value is not a quantity, it does not make sense to use the mean or median.
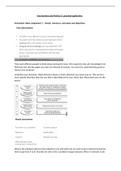
When to use what Measure of Central Tendency:
Chapter 1: Introduction to Statistics
Statistics = the study of how we describe and make inferences from data (Commonly applied to evaluate
scientific observations)
Descriptive statistics = applying statistics to organize and summarize information. Used so other
people can read about it. To make sense or meaning of a list of numeric values.
- Typically presented graphically, in tabular form (tables), or as summary statistics (single values)
- Tables and graphs have the advantage of clarifying findings in a research study
Inferential statistics = allows researchers to infer or generalize observations made with samples to
the larger population from which they were selected.
• Inference = a conclusion reached on the basis of evidence and reasoning
Population = set of all individuals, items, or data of
interest. The group that will be generalized
Population parameter = a characteristic that
describes a population
Sample = set of individuals, items, or data selected
from a population of interest.
Sample statistic = a characteristic that describes a
sample
N = Population size
n = Sample size
The observations researchers make are typically recorded as data; measurements or observations
that are typically numeric. A datum is a single measurement or observation, usually referred to as a
score or raw score.
Structure for making observations:
1. Ask a question
2. Set up a research study
3. Measure behaviour
4. Evaluate findings
Level of measurements (NOIR)
variables
Qualitative
• Nominal = no ranking available
o E.g.: favourite medium, hair colour, nationality, gender, religion
• Ordinal = meaningful ranking/ordering. Distance is unknown
variables
Quantitative
o E.g.: Social class, conservatism, prejudice, preference rankings, market position
• Interval = distance is important
o E.g.: IQ. Fahrenheit (80 degrees is not twice as hot as 40 degrees, because zero is not a total lack of heat),
attitude, opinions
• Ratio = absolute and meaningful zero point (true zero point)
o E.g.: hours of watching tv, age (you can say a person is twice as old as another), sales, income, cost
➔ We always first need to know the level of measurement in order to know which statistical
techniques we may use for the given variable(s).
Unit of analysis = what or whom that is being studied. The unit that you will be able to draw a
conclusion about.
,Variable = a measured property of each of the units of analysis
• Univariate = one variable: ‘what was the average grade if the ISA exam last year?’
• Bivariate = two variables: ‘did males and females differ in their grades?’
• Multivariate = three or more variables: ‘was the grade dependent on the initial motivation,
the time spent on reading and gender’.
Types of variables
Continuous variable = measured along a continuum.
Measured at any place beyond the decimal point. Can thus be measured in fractional units.
But are only measured in whole units or categories
E.g.: 1.0, 2.0, 3.0, etc. But also: 3.14812, 2.7492, and so on.
E.g.: weight, length, time, temperature
Discrete variable = measured in whole units of categories
So, they are not measures along a continuum
E.g.: 1, 2, 3, 4, 5, etc.
E.g.: Sum of two dices, number of students/siblings, amount of change in your pocket
Quantitative variable = by amount, numeric units. Often collected by measuring or counting.
Both continuous and discrete variables can be quantitative
Qualitative variable = varies by class. Often labels for the behaviours we observe
Only discrete variables
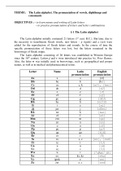
,Chapter 3: Summarizing Data
Central tendency = statistical measures for locating a single score that is most representative or
descriptive of all scores in a distribution. Although we lose some meaning anytime we reduce a set
of data to a single score, statistical measures of central tendency ensure that the single score
meaningfully represents a set of data.
1) Mean
2) Median
3) Mode
Measures of central tendency
• Mean (M) = all values are added up and divided by n, which is the number of observations in
the sample. Only to interval and ratio level of measurements. Mostly used for describing
normally distributed variables.
o Population of Mean =
o Sample mean =
o The ‘balance point’ in a distribution
o Characteristics:
✓ Changing any score will change the mean
✓ Adding or removing a score will change the mean (unless that score is already equal to the
mean)
✓ Adding, subtracting, multiplying, dividing each score by a given value (a ‘constant’)
causes the mean to change accordingly
✓ Sum of difference from the mean is zero → 0 = Σ(x – M)
✓ Sum of squared differences from the mean is minimal → = Σ(x – M2)
• Median = the middle value of a distribution
o (1) Sort all cases based on their value x, (2) the order of the ‘middle case’ equals the median
o Whenever n is an even number, the median is the mean value of two middle cases
𝑛+1
▪ Median position = 2
o Only to ordinal / interval ratio level of measurements
o Often used for interval/ratio variables that have skewed distributions
o It is not as sensitive to outliers as the mean
o The median can be estimated by a cumulative percent distribution
• Mode = the category with the largest amount of cases
o Can be used for nominal, ordinal, interval, ratio variables
Normal distribution (bell curve) = symmetrical distribution in which scores are similarly distributed
above and belove the mean, the median and the mode at the centre of the distribution.
➔ The mean, median, and mode is the same value
Skewed distribution = a distribution of scores that includes outliers or scores that fall substantially
above or below most other scores in a data set.
Positively skewed distribution = in which the outliers are substantially
larger (toward the right tail in a graph) than most other scores
Negatively skewed distribution = in which outliers are substantially
smaller (toward the left tail in a graph) than most other scores.
Skewed distribution
, Distribution types
❖ Modal distribution => in which one or more scores occur most often or most frequently
❖ Unimodal distribution => in which one score occurs most often or most frequently. Have a
single mode.
❖ Bimodal distribution => in which two scores occur most often or most frequently. Has two
modes.
Bimodal distribution
❖ Multimodal distribution => in which more than two scores occur most often or most
frequently. It has more than two modes.
❖ Nonmodal distribution (rectangular distribution) => all scores occur at the same frequency. Is has
no mode at all.
Anytime you see phrases such as most often, typical, or common, the mode is being used to describe
these data.
The mode is used to describe nominal data that identify something or someone, nothing more.
Because a nominal scale value is not a quantity, it does not make sense to use the mean or median.
When to use what Measure of Central Tendency: