IB Geography Unit 1 Notes -Changing Population
, Geography command terms to learn
Questions which begin with a command term in green (AO1) are descriptive and worth few marks in exams: more time should
always be devoted to questions which begin with command terms in blue (AO2) or red (A03) which are more analytical and ar
usually worth more marks on exams papers. Assessment Objectives written in black (AO4) refer to drawing skills (annotated
maps and diagrams, graphs)
● Analyze (AO2): Break down in order to bring out the essential elements or structure
● Annotate (AO4): Add brief notes to a diagram or graph
● Classify (AO2): Arrange or order by class or category
● Compare (AO3): Give an account of the similarities between two (or more) items or situations, referring to both (all) of
them throughout
● Compare and contrast (AO3): Give an account of similarities and differences between two (or more) items or situations,
referring to both (all) of them throughout
● Construct (AO4): Display information in a diagrammatic or logical form
● Contrast (AO3): Give an account of the differences between two (or more) items or situations, referring to both (all) of
them throughout
● Define (AO1): Give the precise meaning of a word, phrase, concept or physical quantity
● Describe (AO1): Give a detailed account
● Determine (AO1): Obtain the only possible answer
● Discuss (AO3): Offer a considered and balanced review that includes a range of arguments, factors or hypotheses. Opinions
or conclusions should be presented clearly and supported by appropriate evidence
● Distinguish (AO2): Make clear the differences between two or more concepts or items
● Draw (AO4): Represent by means of a labelled, accurate diagram or graph, using a pencil. A ruler (straight edge) should be
used for straight lines. Diagrams should be drawn to scale. Graphs should have points correctly plotted (if appropriate) and
joined in a straight line or smooth curve
● Estimate (AO1): Obtain an approximate value
● Evaluate (AO3): Make an appraisal by weighing up the strengths and limitations
● Examine (AO3): Consider an argument or concept in a way that uncovers the assumptions and interrelationships of the issu
● Explain (AO2): Give a detailed account including reasons or causes
● Identify (AO1): Provide an answer from a number of possibilities
● Justify (AO3): Give valid reasons or evidence to support an answer or conclusion
● Label (AO4): Add labels to a diagram
● Outline (AO1): Give a brief account or summary
● State (AO1): Give a specific name, value or other brief answer without explanation or calculation
● Suggest (AO2): Propose a solution, hypothesis or other possible answer
● To what extent (AO3): Consider the merits or otherwise of an argument or concept. Opinions and conclusions should be
presented clearly and supported with empirical evidence and sound argument
,Unit 1 ,Population changes
1.1 Population and economic development patterns
Part 1 = Physical and human factors affecting population distribution at the global scale
LT : To explain human and physical factors affecting population changes
Part 2 = Global patterns and classification of economic development
LT : To identify ways of classifying countries in terms of their level of development
LT : To define economic development and analyze indicators of development
Part 3 = Population distribution and economic development at the national scale, including
voluntary internal migration, core-periphery patterns and megacity growth
ase studies of uneven population distribution = China and South Africa
C
1.2 Changing populations and places
Part 1 = Population change and demographic transition over time, including natural increase,
fertility rate, life expectancy, population structure and dependency ratios
LT : To describe population trends and patterns in births (Crude Birth Rate), natural increase and mortality
(Crude Death Rate, infant and child mortality rates), fertility and life expectancy in contrasting regions of the world
LT : To explain changes in population trends and patterns
LT : To distinguish between population momentum and population projection
LT : To analyze population structure
LT : To explain and calculate ageing and dependency ratios
Case studies of uneven population distribution = Russia and Cambodia
Part 2 = The consequences of megacity growth for individuals and societies
LT : To examine the cause, consequences and responses of megacity growth
Case study = Mumbai
Part 3 = The causes and consequences of forced migration and internal displacement
LT : To examine the causes and consequences of forced migration and internal displacement
Case studies = The Sahel (environmentally forced migration)
, 1.3 Challenges and Opportunities
Part 1 = Global and regional/continental trends in family size, sex ratios, and ageing/greying
LT : To describe and explain global and continental trends in family size, sex ratios, and ageing/greying
populations
Part 2 = Policies associated with managing population change
LT : To evaluate the consequences of population policies related to :
- Ageing societies
Case study = Japan
- Anti-natalist policies
Case study = China’s One Child Policy
- Gender equality policies
Case study = Kerala (India)
- Anti-trafficking policies
Case study = Nigerian women to Europe
art 3 = The demographic dividend and the ways in which population could be considered a
P
resource when contemplating possible futures
, Changing population
Population and economic development patterns
LT : To explain human and physical factors affecting population distribution
Interpreting maps :
❖ Pattern
❖ Latitude
❖ Anomaly
❖ Coast
❖ Example / evidence
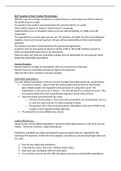
, Factor Explanation Country example
Wars People rarely live in war zones for the fear of death 2003 Iraq War
Altitude Many people do not like the lack of communication The Andes
and shops
Government grants Governments may want to bring in multinationals Sony moved to South
such as Nike which needs a large task force
Wales
Soil fertility Many times farmers in LEDC’s go to where soil is Merapi, Indonesia
fertile rather than where there is space
Healthcare Some countries provide free healthcare which Switzerland
attracts people
Water In places such as the Sahara desert there is little to Niger
no water
LT : To identify ways of classifying countries in terms of their level of development
Random Info :
➔ 75% of the population of the world live within 1000km of the sea
➔ 85% Live within areas less than 500m high.
➔ Less than 10% live in the southern hemisphere
Core periphery = Core countries are those at the center of world economic activity ; periphery countries
are those less affected by global economy flows
Classifications :
LDC’s = Less developed countries
NIC’s = Newly industrialised countries
RIC’s = Recently industrialised countries
LEDC’s = Less economically developed countries
MEDC’s = More economically developed countries
BRIC’S = Brazil, Russia, India, China and South Africa
MINT’s = Mexico, Indonesia, Nigeria, Turkey
CIVETS = Colombia, Indonesia, Vietnam, Egypt, Turkey and South Africa
Next Eleven = Bangladesh, Egypt, Indonesia, Iran, Mexico, Nigeria, Pakistan, Philippines, Turkey, South Korea
and Vietnam
Asian Tigers = Hong Kong, Singapore, South Korea and Taiwan
,LT = To define economic development and analyse indicators of development
Qualitative = Attempts to describe a country's development in terms of those factors which influence
people's quality of life
Quantitative = Use statistics to measure certain aspects of a country
Composite = Combine several other measures into a single figure
HDI MPI
What does it stand for? Human Development Index Multidimensional Poverty Index
What does it measure? Life expectancy at birth, Years of Nutrition : Child mortality, Years o
schooling, GNI schooling / children enrolled,
cooking fuel / toilet / water / floor
space / assets
Strengths of the indicator Simplifies and captures part of It measures how much poverty is in
what human development entails a country as well as whether the
numbers are improving or not
Weaknesses of the indicator It does not include : It measures development only
★ Inequalities povery according to poverty, while
★ Human security disregarding a wide range of other
★ Empowerment
★ Does not include self generating
important factors
income
Case studies : China and South Africa
Forced migration = Forced migration is when a person has to move because of violence, danger, fear of persecution, o
orders by a government or authority. Forced migration can also occur due to environmental reasons such as natural
disasters or famine.
Economic migration = Economic migration is the choice to move to another place in search of a better standard of livin
and a regular wage
Voluntary migration = Voluntary migration is when a person moves from one place to another by their own free will.
They have the option to move or not.
Millionaire city = A city with over a million residents/inhabitants
Megacity = A city with over 10 million inhabitants
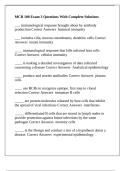
, South Africa
- It is densely populated in the North-East of South Africa with up to 1000 people per square km.
- The West of South Africa is sparsely populated with an average of 0-4 people per square km. An anomaly to this is
Cape town with a population of 1000 or more people per square km.
- The Northern Cape is sparsely populated
- Most of the coastal cities are densely populated
Factor Explanation
Trade The areas touching the coastline are generally more densely populated
than the inland of South Africa, this could be because of trade.
Water The Tugela river and the Vaal river run through the North East part of
Africa. Along here the population is denser because of the many benefits
of the water for agricultural and domestic use.
Rivers Along the Orange river which runs through the West part of South Africa
there are more people than there are in general, for example Upington has
up to 1000 inhabitants per square km and it is close to Orange river. In
addition to this is is good for farmers because they get more fertile soil
thanks to the silt deposits.
Climate In the Kalahari desert in West South Africa there are very few people per
square km due to extreme temperatures.
National Park / In the top North-East border of South Africa and Mozambique there is a
Reserve National Park and therefore nobody lives there because it is against the
law.
Altitude Just below Lesotho there are mountains which make it hard for people to
live there because of transport / communication, in addition to that it is
hard to build buildings on mountains.
Education Larger cities have better schools which is a pull factor.
Migration
South Africa has had three main periods of internal migration during the 20th and 21st centuries:
● Economic migration linked with industrial development until 1950
● Forced migration related to the apartheid movement
● Voluntary migration following the collapse of the apartheid system
, Geography command terms to learn
Questions which begin with a command term in green (AO1) are descriptive and worth few marks in exams: more time should
always be devoted to questions which begin with command terms in blue (AO2) or red (A03) which are more analytical and ar
usually worth more marks on exams papers. Assessment Objectives written in black (AO4) refer to drawing skills (annotated
maps and diagrams, graphs)
● Analyze (AO2): Break down in order to bring out the essential elements or structure
● Annotate (AO4): Add brief notes to a diagram or graph
● Classify (AO2): Arrange or order by class or category
● Compare (AO3): Give an account of the similarities between two (or more) items or situations, referring to both (all) of
them throughout
● Compare and contrast (AO3): Give an account of similarities and differences between two (or more) items or situations,
referring to both (all) of them throughout
● Construct (AO4): Display information in a diagrammatic or logical form
● Contrast (AO3): Give an account of the differences between two (or more) items or situations, referring to both (all) of
them throughout
● Define (AO1): Give the precise meaning of a word, phrase, concept or physical quantity
● Describe (AO1): Give a detailed account
● Determine (AO1): Obtain the only possible answer
● Discuss (AO3): Offer a considered and balanced review that includes a range of arguments, factors or hypotheses. Opinions
or conclusions should be presented clearly and supported by appropriate evidence
● Distinguish (AO2): Make clear the differences between two or more concepts or items
● Draw (AO4): Represent by means of a labelled, accurate diagram or graph, using a pencil. A ruler (straight edge) should be
used for straight lines. Diagrams should be drawn to scale. Graphs should have points correctly plotted (if appropriate) and
joined in a straight line or smooth curve
● Estimate (AO1): Obtain an approximate value
● Evaluate (AO3): Make an appraisal by weighing up the strengths and limitations
● Examine (AO3): Consider an argument or concept in a way that uncovers the assumptions and interrelationships of the issu
● Explain (AO2): Give a detailed account including reasons or causes
● Identify (AO1): Provide an answer from a number of possibilities
● Justify (AO3): Give valid reasons or evidence to support an answer or conclusion
● Label (AO4): Add labels to a diagram
● Outline (AO1): Give a brief account or summary
● State (AO1): Give a specific name, value or other brief answer without explanation or calculation
● Suggest (AO2): Propose a solution, hypothesis or other possible answer
● To what extent (AO3): Consider the merits or otherwise of an argument or concept. Opinions and conclusions should be
presented clearly and supported with empirical evidence and sound argument
,Unit 1 ,Population changes
1.1 Population and economic development patterns
Part 1 = Physical and human factors affecting population distribution at the global scale
LT : To explain human and physical factors affecting population changes
Part 2 = Global patterns and classification of economic development
LT : To identify ways of classifying countries in terms of their level of development
LT : To define economic development and analyze indicators of development
Part 3 = Population distribution and economic development at the national scale, including
voluntary internal migration, core-periphery patterns and megacity growth
ase studies of uneven population distribution = China and South Africa
C
1.2 Changing populations and places
Part 1 = Population change and demographic transition over time, including natural increase,
fertility rate, life expectancy, population structure and dependency ratios
LT : To describe population trends and patterns in births (Crude Birth Rate), natural increase and mortality
(Crude Death Rate, infant and child mortality rates), fertility and life expectancy in contrasting regions of the world
LT : To explain changes in population trends and patterns
LT : To distinguish between population momentum and population projection
LT : To analyze population structure
LT : To explain and calculate ageing and dependency ratios
Case studies of uneven population distribution = Russia and Cambodia
Part 2 = The consequences of megacity growth for individuals and societies
LT : To examine the cause, consequences and responses of megacity growth
Case study = Mumbai
Part 3 = The causes and consequences of forced migration and internal displacement
LT : To examine the causes and consequences of forced migration and internal displacement
Case studies = The Sahel (environmentally forced migration)
, 1.3 Challenges and Opportunities
Part 1 = Global and regional/continental trends in family size, sex ratios, and ageing/greying
LT : To describe and explain global and continental trends in family size, sex ratios, and ageing/greying
populations
Part 2 = Policies associated with managing population change
LT : To evaluate the consequences of population policies related to :
- Ageing societies
Case study = Japan
- Anti-natalist policies
Case study = China’s One Child Policy
- Gender equality policies
Case study = Kerala (India)
- Anti-trafficking policies
Case study = Nigerian women to Europe
art 3 = The demographic dividend and the ways in which population could be considered a
P
resource when contemplating possible futures
, Changing population
Population and economic development patterns
LT : To explain human and physical factors affecting population distribution
Interpreting maps :
❖ Pattern
❖ Latitude
❖ Anomaly
❖ Coast
❖ Example / evidence
, Factor Explanation Country example
Wars People rarely live in war zones for the fear of death 2003 Iraq War
Altitude Many people do not like the lack of communication The Andes
and shops
Government grants Governments may want to bring in multinationals Sony moved to South
such as Nike which needs a large task force
Wales
Soil fertility Many times farmers in LEDC’s go to where soil is Merapi, Indonesia
fertile rather than where there is space
Healthcare Some countries provide free healthcare which Switzerland
attracts people
Water In places such as the Sahara desert there is little to Niger
no water
LT : To identify ways of classifying countries in terms of their level of development
Random Info :
➔ 75% of the population of the world live within 1000km of the sea
➔ 85% Live within areas less than 500m high.
➔ Less than 10% live in the southern hemisphere
Core periphery = Core countries are those at the center of world economic activity ; periphery countries
are those less affected by global economy flows
Classifications :
LDC’s = Less developed countries
NIC’s = Newly industrialised countries
RIC’s = Recently industrialised countries
LEDC’s = Less economically developed countries
MEDC’s = More economically developed countries
BRIC’S = Brazil, Russia, India, China and South Africa
MINT’s = Mexico, Indonesia, Nigeria, Turkey
CIVETS = Colombia, Indonesia, Vietnam, Egypt, Turkey and South Africa
Next Eleven = Bangladesh, Egypt, Indonesia, Iran, Mexico, Nigeria, Pakistan, Philippines, Turkey, South Korea
and Vietnam
Asian Tigers = Hong Kong, Singapore, South Korea and Taiwan
,LT = To define economic development and analyse indicators of development
Qualitative = Attempts to describe a country's development in terms of those factors which influence
people's quality of life
Quantitative = Use statistics to measure certain aspects of a country
Composite = Combine several other measures into a single figure
HDI MPI
What does it stand for? Human Development Index Multidimensional Poverty Index
What does it measure? Life expectancy at birth, Years of Nutrition : Child mortality, Years o
schooling, GNI schooling / children enrolled,
cooking fuel / toilet / water / floor
space / assets
Strengths of the indicator Simplifies and captures part of It measures how much poverty is in
what human development entails a country as well as whether the
numbers are improving or not
Weaknesses of the indicator It does not include : It measures development only
★ Inequalities povery according to poverty, while
★ Human security disregarding a wide range of other
★ Empowerment
★ Does not include self generating
important factors
income
Case studies : China and South Africa
Forced migration = Forced migration is when a person has to move because of violence, danger, fear of persecution, o
orders by a government or authority. Forced migration can also occur due to environmental reasons such as natural
disasters or famine.
Economic migration = Economic migration is the choice to move to another place in search of a better standard of livin
and a regular wage
Voluntary migration = Voluntary migration is when a person moves from one place to another by their own free will.
They have the option to move or not.
Millionaire city = A city with over a million residents/inhabitants
Megacity = A city with over 10 million inhabitants
, South Africa
- It is densely populated in the North-East of South Africa with up to 1000 people per square km.
- The West of South Africa is sparsely populated with an average of 0-4 people per square km. An anomaly to this is
Cape town with a population of 1000 or more people per square km.
- The Northern Cape is sparsely populated
- Most of the coastal cities are densely populated
Factor Explanation
Trade The areas touching the coastline are generally more densely populated
than the inland of South Africa, this could be because of trade.
Water The Tugela river and the Vaal river run through the North East part of
Africa. Along here the population is denser because of the many benefits
of the water for agricultural and domestic use.
Rivers Along the Orange river which runs through the West part of South Africa
there are more people than there are in general, for example Upington has
up to 1000 inhabitants per square km and it is close to Orange river. In
addition to this is is good for farmers because they get more fertile soil
thanks to the silt deposits.
Climate In the Kalahari desert in West South Africa there are very few people per
square km due to extreme temperatures.
National Park / In the top North-East border of South Africa and Mozambique there is a
Reserve National Park and therefore nobody lives there because it is against the
law.
Altitude Just below Lesotho there are mountains which make it hard for people to
live there because of transport / communication, in addition to that it is
hard to build buildings on mountains.
Education Larger cities have better schools which is a pull factor.
Migration
South Africa has had three main periods of internal migration during the 20th and 21st centuries:
● Economic migration linked with industrial development until 1950
● Forced migration related to the apartheid movement
● Voluntary migration following the collapse of the apartheid system