Lecture 1. INTRODUCTION
● Psychometrics:assessing the attributes of psychologicaltests
○ Interindividual = compare the behavior of different people
○ Intraindividual = compare the behavior of the same person at different points in
time
● Criterion-referenced tests: compare each score withapredeterminedcut-off point
● Norm-referenced tests:compare each score with areferencesampleandnorm
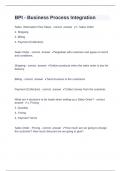
● Path diagram
○ Latent variable (unobservable)
○ Items (observable)
○ Error (unobservable LV)
● Psychological theory
○ Decides what is relevant to be measured
○ Informs statistics: make “distributional assumptions” based on theory
● Statistics: analysis of individual differences
● Causality
○ Relative items:item directly and causally relatedto the LV
(correlated)
○ Formative items: items are not causally dependenton the
index variable - items scores determine the test score
● Properties of Numeral
○ Property of identity: differentiate between categoriesof people (mutuallyexclusive&exhaustive)
○ Property of order:indicate therankorderof peoplerelative to each other along asingledimension
(implies transitivity)
○ Property of quantity: adds information concerningamountto the numeral expressed in numerical counts
of units
■ Absolute zero:absence of the attribute
■ Relative zero:assignments of zero to an arbitraryvalue
● Measurement Levels
○ Nominal scale: Numbers are simply ways to codecategoricalinformation
■ Property of identity
○ Ordinal scale:Numbers assigned have meaning in thatthey demonstrate arank orderof the classes
■ Property of identity & order
○ Interval scale: Provides a rank order of objects wheredifferences in scale values expressdifferences in
amount
■ Property of identity + order + amount
■ Zero isrelative(not absolute)
○ Ratio scale: Property of identity + order + amount+absolute zero
,Lecture 2. LINEAR REGRESSION
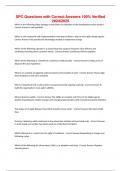
● Linear regression = conditionalMEAN.
o Conditional mean:mean score on a variable given thescore on another variable.
● If we have Y= b0 + b1 * x → no te olvides que es la formula predicted value!! (y=ȳ).
o b0 : intercept/constant: predicted value ofywhenx= 0.
o b
1 : slope :regression coefficient: relationshipbetweenxandy: change iny,
asxincreases by 1.
o No error.
o Predicted formula and not observed one.
o We look at the red line instead of a gray line.
● Conditional mean(of y) = Predicted mean(of y).
● Notation y I x
o y given x.
o Conditional mean
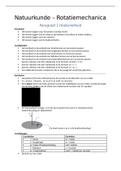
● Assumptionsdistribution of ylinear regression (3):
1. It needs to be linear regression.
2. yis normally distributed for all values ofx
o F or each value of x, y needs to be normally distributed, and the mean of normal distribution
equals the predicted score of y
o Therefore, thepredicted score of y=conditional mean.
3. Variation(SD) in scores onyis the same for allvalues ofx.
● No assumptions fordistribution of x.
● b1: represent also the difference between the scoresby the two variables. Ex: differences score men and woman.
● Is the relationship relevant?→we need to study→R2=varianceof yexplainedby x = measure effectsize.
o var (y) explained variance by x=b1 2 * var (x)
o var (y) not explained variance by x=standard errorof the estimate =var (e)
o Total variance (y)= b12* var (x)+var (e)
o R2=b12* var (x)/ (b1 2* var (x)+var (e))
● Psychological variables → standardize score → multiple ways to do this:
1. Z-score
o Z score - does NOT require assumption of normality (M and s)
o Normalize Z score (based on empirical percentile score) - requires assumption of normality.
2. Other distributions (t-score)
3. Percentile score
o Empirical
● Does not required normal distribution
● F rom empirical tonormalizez score also possible→ assuming normal distribution from
population
● Based on data
● Theoretical(table)
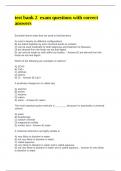
F rom z-score to percentile score
●
● Normally distributed
● Interpreting scores
○ Variance: how much the scores in a distribution deviatefrom the mean
○ Standard deviation:square root variance
, S kewed distribution:positive → right tail/ negative → left tail
○
○ Kurtosis: positive → taller / negative → shorter
○ Covariance: degree of association between thevariabilityintwo
distributions(positive/ negative)
■ Provides information aboutdirection
○ Correlation: Degree of association between two variables
(strong/ weak)
○ Correlation coefficient: number of correlation - from-1
to +1
○ Reflectsmagnitude: close to -1 or +1 means that the
association is very strong
● Psychometrics:assessing the attributes of psychologicaltests
○ Interindividual = compare the behavior of different people
○ Intraindividual = compare the behavior of the same person at different points in
time
● Criterion-referenced tests: compare each score withapredeterminedcut-off point
● Norm-referenced tests:compare each score with areferencesampleandnorm
● Path diagram
○ Latent variable (unobservable)
○ Items (observable)
○ Error (unobservable LV)
● Psychological theory
○ Decides what is relevant to be measured
○ Informs statistics: make “distributional assumptions” based on theory
● Statistics: analysis of individual differences
● Causality
○ Relative items:item directly and causally relatedto the LV
(correlated)
○ Formative items: items are not causally dependenton the
index variable - items scores determine the test score
● Properties of Numeral
○ Property of identity: differentiate between categoriesof people (mutuallyexclusive&exhaustive)
○ Property of order:indicate therankorderof peoplerelative to each other along asingledimension
(implies transitivity)
○ Property of quantity: adds information concerningamountto the numeral expressed in numerical counts
of units
■ Absolute zero:absence of the attribute
■ Relative zero:assignments of zero to an arbitraryvalue
● Measurement Levels
○ Nominal scale: Numbers are simply ways to codecategoricalinformation
■ Property of identity
○ Ordinal scale:Numbers assigned have meaning in thatthey demonstrate arank orderof the classes
■ Property of identity & order
○ Interval scale: Provides a rank order of objects wheredifferences in scale values expressdifferences in
amount
■ Property of identity + order + amount
■ Zero isrelative(not absolute)
○ Ratio scale: Property of identity + order + amount+absolute zero
,Lecture 2. LINEAR REGRESSION
● Linear regression = conditionalMEAN.
o Conditional mean:mean score on a variable given thescore on another variable.
● If we have Y= b0 + b1 * x → no te olvides que es la formula predicted value!! (y=ȳ).
o b0 : intercept/constant: predicted value ofywhenx= 0.
o b
1 : slope :regression coefficient: relationshipbetweenxandy: change iny,
asxincreases by 1.
o No error.
o Predicted formula and not observed one.
o We look at the red line instead of a gray line.
● Conditional mean(of y) = Predicted mean(of y).
● Notation y I x
o y given x.
o Conditional mean
● Assumptionsdistribution of ylinear regression (3):
1. It needs to be linear regression.
2. yis normally distributed for all values ofx
o F or each value of x, y needs to be normally distributed, and the mean of normal distribution
equals the predicted score of y
o Therefore, thepredicted score of y=conditional mean.
3. Variation(SD) in scores onyis the same for allvalues ofx.
● No assumptions fordistribution of x.
● b1: represent also the difference between the scoresby the two variables. Ex: differences score men and woman.
● Is the relationship relevant?→we need to study→R2=varianceof yexplainedby x = measure effectsize.
o var (y) explained variance by x=b1 2 * var (x)
o var (y) not explained variance by x=standard errorof the estimate =var (e)
o Total variance (y)= b12* var (x)+var (e)
o R2=b12* var (x)/ (b1 2* var (x)+var (e))
● Psychological variables → standardize score → multiple ways to do this:
1. Z-score
o Z score - does NOT require assumption of normality (M and s)
o Normalize Z score (based on empirical percentile score) - requires assumption of normality.
2. Other distributions (t-score)
3. Percentile score
o Empirical
● Does not required normal distribution
● F rom empirical tonormalizez score also possible→ assuming normal distribution from
population
● Based on data
● Theoretical(table)
F rom z-score to percentile score
●
● Normally distributed
● Interpreting scores
○ Variance: how much the scores in a distribution deviatefrom the mean
○ Standard deviation:square root variance
, S kewed distribution:positive → right tail/ negative → left tail
○
○ Kurtosis: positive → taller / negative → shorter
○ Covariance: degree of association between thevariabilityintwo
distributions(positive/ negative)
■ Provides information aboutdirection
○ Correlation: Degree of association between two variables
(strong/ weak)
○ Correlation coefficient: number of correlation - from-1
to +1
○ Reflectsmagnitude: close to -1 or +1 means that the
association is very strong