Prüfung
Information_Visualization_Week5_NEC_Solved
Bewertung
Verkauft
-
seiten
9
Klasse
A+
Hochgeladen auf
24-08-2023
geschrieben in
2023/2024
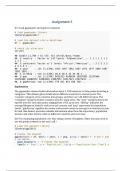
Experiment with the gapminder data to practice some of the new geoms we have learned. Try examining population or life expectancy over time using a series of boxplots. (Hint: you may need to use the group aesthetic in the aes() call.) Can you facet this boxplot by continent? Is anything different if you create a tibble from gapminder that explicitly groups the data by year and continent first, and then create your plots with that? Comment your code line by line. Explain what your charts are showing. Submit an R Markdown or submit screenshots with timestamps in a single Word file documenting your code and outcome .
Mehr anzeigen
Weniger lesen
Hochschule
Information Visualization
Kurs
Information Visualization
Ups! Dein Dokument kann gerade nicht geladen werden. Versuch es erneut oder kontaktiere den Support.
Verknüpftes buch
Data Visualization
- 2018
- 9780691181622
- Unbekannt
Schule, Studium & Fach
- Hochschule
- Information Visualization
- Kurs
- Information Visualization
Dokument Information
- Hochgeladen auf
- 24. august 2023
- Anzahl der Seiten
- 9
- geschrieben in
- 2023/2024
- Typ
- Prüfung
- Enthält
- Fragen & Antworten
Themen
-
informationvisualizationweek5necsolved
9,37 €
Vollständigen Zugriff auf das Dokument erhalten:
Falsches Dokument? Kostenlos tauschen
Innerhalb von 14 Tagen nach dem Kauf und vor dem Herunterladen kannst du ein anderes Dokument wählen. Du kannst den Betrag einfach neu ausgeben.
Geschrieben von Student*innen, die bestanden haben
Sofort verfügbar nach Zahlung
Online lesen oder als PDF
Ebenfalls erhältlich im paket-deal
Paket-Deal
Information_Visualization_NEC_All_7_Weeks_Solved
8
2023
€ 74,99
Mehr infos