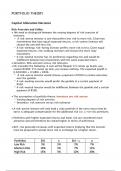
PORTFOLIO THEORY
Capital Allocation Decision
Risk Aversion and Utility:
• We need to distinguish between the varying degrees of risk aversion of
investors:
- A risk-averse investor is one that prefers less risk to more risk. Given two
investments that have equal expected returns, a risk-averse investor will
choose the one with less risk.
- A risk-seeking/ risk-loving investor prefers more risk to less. Given equal
expected returns, risk-seeking investors will choose the more risky
investment.
- A risk-neutral investor has no preference regarding risk and would be
indi erent between two investments with the same expected return.
• Semantics: Risk aversion versus risk tolerance
• EG: Consider the following: A coin will be ipped; if it comes up heads, you
receive R1000; if it comes up tails, you receive nothing. The expected payo is
0.5(R1000) + 0.5(R0) = R500.
- A risk-averse investor would choose a payment of R500 (a certain outcome)
over the gamble.
- A risk-seeking investor would prefer the gamble to a certain payment of
R500.
- A risk-neutral investor would be indi erent between the gamble and a certain
payment of R500.
• The assumption of portfolio theory: investors are risk averse
- Varying degrees of risk aversion
- Semantics: risk aversion versus risk tolerance
• A risk-averse investor will only hold a risky portfolio if the extra return that he
earns is adequate compensation for the additional risk (i.e. a +ve risk premium).
• Portfolios with higher expected returns and lower risk are considered more
attractive and will therefore be ranked higher in terms of preference.
• BUT, risk generally increases with expected returns implying that the investor
must be prepared to accept more risk in exchange for a higher return.
ff ff fl ff
, • An investor’s utility function represents the investor’s preferences in terms of
risk and return (i.e. his/her degree of risk aversion).
• We assume that expected return and risk are the only portfolio characteristics
that investors care about.
• An indi erence curve (IC) is a tool from economics that, in this application, plots
combinations of expected return and risk (standard deviation) among which an
investor is indi erent.
• The investor’s utility is the same for all points along a single IC.
• IC I1 represents the most preferred portfolios; the investor will
prefer any portfolio along I1 to any portfolio on either I2 or I3.
• For a risk-averse investor:
• ICs slope upward for risk-averse investors as they will only take on more risk if
they are compensated with greater expected returns. This is known as the risk-
return trade-o .
- A more risk averse investor requires a greater increase in expected return to
compensate for a given increase in risk so their ICs will be steeper re ecting a
higher risk aversion coe cient (see next gure).
- A less risk averse investor requires a smaller increase in expected return to
compensate for a given increase in risk so their ICs will be atter re ecting a
lower risk aversion coe cient (see next gure).
ff ffff ffi
ffi fifi fl fl fl
, • Although we focus only on risk-averse investors going forward, it is worth
noting:
- As a risk-neutral investor is not concerned about risk but only the rate of
return, their indi erence curves will be at.
- A risk-loving investor is prepared to accept lower expected returns as risk
increases so their indi erence curves will be downward sloping.
• Risk-averse vs risk-loving vs risk-neutral investors:
• To rank investment portfolios, it is necessary to assign them a level or measure
of utility which is based on expected return and variance. This is de ned by:
• U is utility (also known as the certainty equivalent rate of return) and A is the
coe cient of risk aversion.
• Formula tells us utility is enhanced by higher expected returns and reduced by
higher risk and risk aversion
ffi ff ff fl fi