Economics IGCSE (0455)
Chapter 6 Economic indicators
Price inflation
Main objective is to keep price inflation low and stable
High and rising inflation is a problem because it lessens the
value of money
The rate of inflation is measured by changes in consumer or
retail price index (CPI or RPI)
What is inflation
• Refers to a general and sustained rise in the level of
goods and services
• Prices change over time, so inflation is always expressed
as the rate of change per period of time per month or per
year
• If prices rise at a phenomenal rate and money becomes
almost worthless – hyperinflation
How to measure inflation
ÞConsumer price indices
ÞThe rate of price inflation in an economy is measured by
calculating the average percentage change in the prices of
all goods and services
ÞDifficult to measure all goods and services in an economy
so most countries track a selection of goods and services
a typical family would purchase in their ‘basket’
ÞThis will then be used to compile a consumer price index
or a retail price index.
ÞCPI is the main measurement – affecting consumers.
Usually include sales taxes and excise taxes paid by
consumers
, Calculating a price index
Þ Index number series or indices are a way of expressing
the change in the prices of a number of different
products in one number
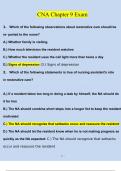
For example
Types of goods Proportion of Average price of Weighted
and services weekly expenditure good or service average price
(%) (dollars)
Clothing 25 40 0.25 x 40 = 10
Household goods 15 60 0.15 x 60 = 9
and services
food 40 5 0.40 x 5 = 2
travel 20 20 0.20 x 20 = 4
total 100 Price of basket
= 25
This is the base year
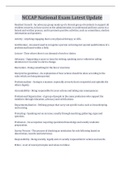
Now there is an increase
Types of goods Proportion of Average price of Weighted
and services weekly expenditure good or service average price
(%) (dollars)
Clothing 25 44 0.25 x 44 = 11
Household goods 10 90 0.10 x 90 = 9
and services
food 50 8 0.50 x 8 = 4
travel 15 20 0.15 x 20 = 3
total 100 Price of basket
= 27
Chapter 6 Economic indicators
Price inflation
Main objective is to keep price inflation low and stable
High and rising inflation is a problem because it lessens the
value of money
The rate of inflation is measured by changes in consumer or
retail price index (CPI or RPI)
What is inflation
• Refers to a general and sustained rise in the level of
goods and services
• Prices change over time, so inflation is always expressed
as the rate of change per period of time per month or per
year
• If prices rise at a phenomenal rate and money becomes
almost worthless – hyperinflation
How to measure inflation
ÞConsumer price indices
ÞThe rate of price inflation in an economy is measured by
calculating the average percentage change in the prices of
all goods and services
ÞDifficult to measure all goods and services in an economy
so most countries track a selection of goods and services
a typical family would purchase in their ‘basket’
ÞThis will then be used to compile a consumer price index
or a retail price index.
ÞCPI is the main measurement – affecting consumers.
Usually include sales taxes and excise taxes paid by
consumers
, Calculating a price index
Þ Index number series or indices are a way of expressing
the change in the prices of a number of different
products in one number
For example
Types of goods Proportion of Average price of Weighted
and services weekly expenditure good or service average price
(%) (dollars)
Clothing 25 40 0.25 x 40 = 10
Household goods 15 60 0.15 x 60 = 9
and services
food 40 5 0.40 x 5 = 2
travel 20 20 0.20 x 20 = 4
total 100 Price of basket
= 25
This is the base year
Now there is an increase
Types of goods Proportion of Average price of Weighted
and services weekly expenditure good or service average price
(%) (dollars)
Clothing 25 44 0.25 x 44 = 11
Household goods 10 90 0.10 x 90 = 9
and services
food 50 8 0.50 x 8 = 4
travel 15 20 0.15 x 20 = 3
total 100 Price of basket
= 27