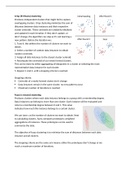
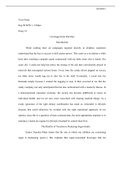
Crisp (K-Means) clustering
Produces independent clusters that might fail to capture
overlapping clusters. Crisp clustering minimizes the sum of
distances between data instances and their respective
cluster centroids. These centroids are randomly initialized
and updated in each iteration. If they don’t update, or
don’t change, the algorithm can stop as it’s not learning a
new pattern. Before the iteration we:
1. Tune K, this defines the number of clusters we want to
obtain.
2. Select a number of random data instances to obtain
random centroids.
3. Assign all data instances to the closest cluster centroid.
4. Recompute the centroids of our newly formed clusters.
This can be done by either aggregating all datapoints in a cluster or selecting the most
representative data instance for each cluster.
5. Repeat 3. And 4. until a stopping criteria is reached.
Stopping criteria:
Centroids of a newly formed cluster don’t change
Data instances remain in the same cluster; no new patterns occur
Maximum number of iterations is reached
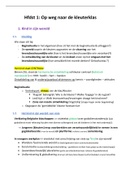
Fuzzy (c-means) clustering
Produces clusters where each data instance belongs to a group with a membership degree.
Data instances can belong to more than one cluster. Each instance will be evaluated and
returns a membership degree between 0 and 1. This value
indicates how much this instance belongs to a certain cluster.
We can tune c as the number of clusters we want to obtain. Next
to calculating clusters, fuzzy computes prototypes; weighted
aggregations of instances. These prototypes can be used to
summarize the data.
The objective of fuzzy clustering is to minimize the sum of distances between each data
instance and all clusters.
The stopping criteria are the same as k-means; either the prototypes don’t change or we
reach a maximum number of iterations.
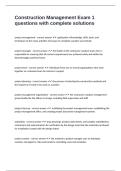
,Hierarchical clustering
Provides a hierarchy of clusters. Doesn’t have tunable parameters.
Useful when we don’t know how many clusters we should obtain to properly represent the
problem under investigation.
Text mining
Representing, mathematically interpreting, inferring knowledge from text. This is very
complex.
Preprocessing noisy text
Just lowercasing and removing punctuation is very naïve.
Tokenization: looks for whitespaces and special tokens. I’m -> I am.
Lemmatization: grouping of variances of a word so they can be analyzed as a single item.
Watches, watching -> watch.
Tokenization and lemmatization give more interesting vocabularies without noise.
Named-entity recognition: find patterns that indicate some token is a person’s name.
Language normalization: find the meaning of an actual world. Gurl -> Girl.
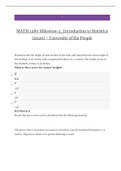
Document similarity: Jaccard coefficient
Compares members for two sets which members are shared and which members are
distinct:
words∈ A∧B
J ( A , B)=
words∈ A∨B
With 0 indicating no overlap and 1 indicating complete overlap.
For example:
Data Language Learning Mining Text Vision Y
1 0 1 0 0 1 Computer vision
1 1 1 0 1 0 NLP
1 0 1 1 1 0 Text mining
2 words ∈d 0∧d 1 2
J ( d 0 , d 1)= = =0.4
5 words ∈d 0∨d 1 5
So not much similarity between computer vision and NLP.
, 3 words ∈d 1∧d 2 3
J ( d 1 , d 2)= = =0.6
5 words∈d 1∨d 2 5
There is more similarity between NLP and text mining.
Term frequency, inverse term frequency
Term frequency means how often a term occurs in a document. There is a problem with
calculating term frequencies; the longer a document, the higher the probability a term will
occur and thus get more weight.
The inverse term frequencies account for the fact that rarer terms should actually be more
informative:
N
Inverse document frequenc y ( IDF)=log
dft
Where N is the total number of documents and dft the number of documents containing a
certain term.
Term frequency – inverse document frequency, or tf*idf, is a statistic intended to reflect
how important a term is to a document in a collection of documents. Its weighting helps to
adjust for the fact that some words appear more frequently in general. However, we still
don’t account for the fact that longer documents will be weighted more.
For example:
Document 1 Document 2
Term Term Count Term Term count
This 1 This 1
Is 1 Is 1
A 2 Another 2
Sample 1 Example 3
Term = “example”
Tf(example,d1) = 0/5 = 0.
Tf(example,d2) = 3/7 = 0.429.
Idf(example,D) = log(2/1) = 0.301.
Tf*idf(example,d1,D) = 0*0.301 = 0
Tf*idf(example,d2,D) = 0.429*0.301 = 0.129
Feature selection
Feature selection is the process of selecting a subset of relevant features. This subset has
the same predictive power as the original dataset.
Feature selection:
Reduces complexity of a model
Reduces demand on hardware sources
Reduces the “curse of dimensionality”
Produces independent clusters that might fail to capture
overlapping clusters. Crisp clustering minimizes the sum of
distances between data instances and their respective
cluster centroids. These centroids are randomly initialized
and updated in each iteration. If they don’t update, or
don’t change, the algorithm can stop as it’s not learning a
new pattern. Before the iteration we:
1. Tune K, this defines the number of clusters we want to
obtain.
2. Select a number of random data instances to obtain
random centroids.
3. Assign all data instances to the closest cluster centroid.
4. Recompute the centroids of our newly formed clusters.
This can be done by either aggregating all datapoints in a cluster or selecting the most
representative data instance for each cluster.
5. Repeat 3. And 4. until a stopping criteria is reached.
Stopping criteria:
Centroids of a newly formed cluster don’t change
Data instances remain in the same cluster; no new patterns occur
Maximum number of iterations is reached
Fuzzy (c-means) clustering
Produces clusters where each data instance belongs to a group with a membership degree.
Data instances can belong to more than one cluster. Each instance will be evaluated and
returns a membership degree between 0 and 1. This value
indicates how much this instance belongs to a certain cluster.
We can tune c as the number of clusters we want to obtain. Next
to calculating clusters, fuzzy computes prototypes; weighted
aggregations of instances. These prototypes can be used to
summarize the data.
The objective of fuzzy clustering is to minimize the sum of distances between each data
instance and all clusters.
The stopping criteria are the same as k-means; either the prototypes don’t change or we
reach a maximum number of iterations.
,Hierarchical clustering
Provides a hierarchy of clusters. Doesn’t have tunable parameters.
Useful when we don’t know how many clusters we should obtain to properly represent the
problem under investigation.
Text mining
Representing, mathematically interpreting, inferring knowledge from text. This is very
complex.
Preprocessing noisy text
Just lowercasing and removing punctuation is very naïve.
Tokenization: looks for whitespaces and special tokens. I’m -> I am.
Lemmatization: grouping of variances of a word so they can be analyzed as a single item.
Watches, watching -> watch.
Tokenization and lemmatization give more interesting vocabularies without noise.
Named-entity recognition: find patterns that indicate some token is a person’s name.
Language normalization: find the meaning of an actual world. Gurl -> Girl.
Document similarity: Jaccard coefficient
Compares members for two sets which members are shared and which members are
distinct:
words∈ A∧B
J ( A , B)=
words∈ A∨B
With 0 indicating no overlap and 1 indicating complete overlap.
For example:
Data Language Learning Mining Text Vision Y
1 0 1 0 0 1 Computer vision
1 1 1 0 1 0 NLP
1 0 1 1 1 0 Text mining
2 words ∈d 0∧d 1 2
J ( d 0 , d 1)= = =0.4
5 words ∈d 0∨d 1 5
So not much similarity between computer vision and NLP.
, 3 words ∈d 1∧d 2 3
J ( d 1 , d 2)= = =0.6
5 words∈d 1∨d 2 5
There is more similarity between NLP and text mining.
Term frequency, inverse term frequency
Term frequency means how often a term occurs in a document. There is a problem with
calculating term frequencies; the longer a document, the higher the probability a term will
occur and thus get more weight.
The inverse term frequencies account for the fact that rarer terms should actually be more
informative:
N
Inverse document frequenc y ( IDF)=log
dft
Where N is the total number of documents and dft the number of documents containing a
certain term.
Term frequency – inverse document frequency, or tf*idf, is a statistic intended to reflect
how important a term is to a document in a collection of documents. Its weighting helps to
adjust for the fact that some words appear more frequently in general. However, we still
don’t account for the fact that longer documents will be weighted more.
For example:
Document 1 Document 2
Term Term Count Term Term count
This 1 This 1
Is 1 Is 1
A 2 Another 2
Sample 1 Example 3
Term = “example”
Tf(example,d1) = 0/5 = 0.
Tf(example,d2) = 3/7 = 0.429.
Idf(example,D) = log(2/1) = 0.301.
Tf*idf(example,d1,D) = 0*0.301 = 0
Tf*idf(example,d2,D) = 0.429*0.301 = 0.129
Feature selection
Feature selection is the process of selecting a subset of relevant features. This subset has
the same predictive power as the original dataset.
Feature selection:
Reduces complexity of a model
Reduces demand on hardware sources
Reduces the “curse of dimensionality”