1
Fundamental Macroeconomics
IS-LM
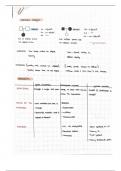
- IS curve shows relationship between r and Y in the goods market
The Keynesian Cross
- This model is the simplest interpretation of Keynes’ theory of how national
income is determined
- Planned expenditure = the amount that households, firms and the government
would like to spend
- Actual and planned expenditure because firms may have unplanned
investment that they suddenly need to make etc
Three ways of expressing equilibrium:
1. Y = C + I + G
• This shows that income = aggregate demand as the components on the
right-hand side of the equation represents aggregate demand.
2. C + S + T = Y = C + I + G
S+T=I+G
• The left-hand side of the equation shows what national income is made
of. They contribute to national income.
• The right-hand side shows output
• This equation shows that output = national income
3. C + Ir + G = Y = C + I + G
Ir = I
• This shows that output = national product
, 2
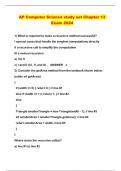
• At any point along the 45 degree line, aggregate demand = income
• a = autonomous consumption
• b = mpc (slope of the consumption function)
• Y = income
• The second graph shows that investment and government consumption
are exogenous as they are not affected by income
Maths
𝑦 =𝐶+𝐼+𝐺
𝑦 = 𝑎 + 𝑦𝑑 = 𝑎 + 𝑏(𝑦 − 𝑇)
𝑦 = 𝑎 + 𝑏𝑦 − 𝑏𝑇 + 𝐼 + 𝐺
𝑦 − 𝑏𝑦 = 𝑎 − 𝑏𝑇 + 𝐼 + 𝐺
𝑦(1 − 𝑏) = 𝑎 − 𝑏𝑇 + 𝐼 + 𝐺
𝑎 − 𝑏𝑇 + 𝐼 + 𝐺
𝑦=
(1 − 𝑏)
1
𝑦= [𝑎 − 𝑏𝑇 + 𝐼 + 𝐺]
1−𝑏
Multiplier for government consumption:
𝛥𝑦 1
= [𝐺 1−1 ]
𝛥𝐺 1 − 𝑏
1
[1]
1−𝑏
1
1−𝑏
• If government purchases rise by 𝛥𝐺, then the planned-expenditure
schedule schedule shifts upwards by 𝛥𝐺.
Multiplier for taxes
𝛥𝑦 1
= [−𝑏𝑇 1−1 ]
𝛥𝑇 1 − 𝑏
, 3
1
[−𝑏𝑇 0 ]
1−𝑏
1
[−𝑏 × 1]
1−𝑏
−𝑏
1−𝑏
Balanced budget multiplier:
Mario Draghi
• He brings attention to two aspects
1. Uncertainty – leads to more saving and less investment
2. Monetary stimulus – decreased interest rate increases borrowing
and spending. It acts as a solution for uncertainty.
Derivation of the IS curve
• An increase in the interest rate will reduce planned investment
• Interest is ultimately the determinant of investment
• Changes in the rate of interest affect aggregate demand/ aggregate
expenditure by causing changes in the investment demand
• The IS curve relates different equilibrium levels of national income with
various rates of interest
• Planned investment is I=I(r), showing that investment depends on the
interest rate
, 4
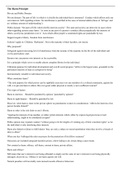
- On every point on the IS curve, the economy is in equilibrium, so AE = PE
Factors affecting the slope of the IS curve:
• A less steep (flat) investment function = steeper IS curve
• The IS curve is steep when investment is insensitive to changes in the
interest rate
Shifts in the IS schedule
• Government spending changes
• Consumption changes
• Tax changes
• Net export changes
IS schedule maths
𝐼+𝐺 =𝑆+𝑇
𝑆 = −𝑎 + (1 − 𝑏)𝑦𝑑
𝑆 = −𝑎 + (1 − 𝑏)(𝑦 − 𝑡)
Investment function:
𝐼 = 𝐼 ̅ − 𝑖1 𝑟
Where 𝑖1 > 0
𝐼 ̅ − 𝑖1 𝑟 + 𝐺 = −𝑎 + (1 − 𝑏)(𝑦 − 𝑇) + 𝑇
Fundamental Macroeconomics
IS-LM
- IS curve shows relationship between r and Y in the goods market
The Keynesian Cross
- This model is the simplest interpretation of Keynes’ theory of how national
income is determined
- Planned expenditure = the amount that households, firms and the government
would like to spend
- Actual and planned expenditure because firms may have unplanned
investment that they suddenly need to make etc
Three ways of expressing equilibrium:
1. Y = C + I + G
• This shows that income = aggregate demand as the components on the
right-hand side of the equation represents aggregate demand.
2. C + S + T = Y = C + I + G
S+T=I+G
• The left-hand side of the equation shows what national income is made
of. They contribute to national income.
• The right-hand side shows output
• This equation shows that output = national income
3. C + Ir + G = Y = C + I + G
Ir = I
• This shows that output = national product
, 2
• At any point along the 45 degree line, aggregate demand = income
• a = autonomous consumption
• b = mpc (slope of the consumption function)
• Y = income
• The second graph shows that investment and government consumption
are exogenous as they are not affected by income
Maths
𝑦 =𝐶+𝐼+𝐺
𝑦 = 𝑎 + 𝑦𝑑 = 𝑎 + 𝑏(𝑦 − 𝑇)
𝑦 = 𝑎 + 𝑏𝑦 − 𝑏𝑇 + 𝐼 + 𝐺
𝑦 − 𝑏𝑦 = 𝑎 − 𝑏𝑇 + 𝐼 + 𝐺
𝑦(1 − 𝑏) = 𝑎 − 𝑏𝑇 + 𝐼 + 𝐺
𝑎 − 𝑏𝑇 + 𝐼 + 𝐺
𝑦=
(1 − 𝑏)
1
𝑦= [𝑎 − 𝑏𝑇 + 𝐼 + 𝐺]
1−𝑏
Multiplier for government consumption:
𝛥𝑦 1
= [𝐺 1−1 ]
𝛥𝐺 1 − 𝑏
1
[1]
1−𝑏
1
1−𝑏
• If government purchases rise by 𝛥𝐺, then the planned-expenditure
schedule schedule shifts upwards by 𝛥𝐺.
Multiplier for taxes
𝛥𝑦 1
= [−𝑏𝑇 1−1 ]
𝛥𝑇 1 − 𝑏
, 3
1
[−𝑏𝑇 0 ]
1−𝑏
1
[−𝑏 × 1]
1−𝑏
−𝑏
1−𝑏
Balanced budget multiplier:
Mario Draghi
• He brings attention to two aspects
1. Uncertainty – leads to more saving and less investment
2. Monetary stimulus – decreased interest rate increases borrowing
and spending. It acts as a solution for uncertainty.
Derivation of the IS curve
• An increase in the interest rate will reduce planned investment
• Interest is ultimately the determinant of investment
• Changes in the rate of interest affect aggregate demand/ aggregate
expenditure by causing changes in the investment demand
• The IS curve relates different equilibrium levels of national income with
various rates of interest
• Planned investment is I=I(r), showing that investment depends on the
interest rate
, 4
- On every point on the IS curve, the economy is in equilibrium, so AE = PE
Factors affecting the slope of the IS curve:
• A less steep (flat) investment function = steeper IS curve
• The IS curve is steep when investment is insensitive to changes in the
interest rate
Shifts in the IS schedule
• Government spending changes
• Consumption changes
• Tax changes
• Net export changes
IS schedule maths
𝐼+𝐺 =𝑆+𝑇
𝑆 = −𝑎 + (1 − 𝑏)𝑦𝑑
𝑆 = −𝑎 + (1 − 𝑏)(𝑦 − 𝑡)
Investment function:
𝐼 = 𝐼 ̅ − 𝑖1 𝑟
Where 𝑖1 > 0
𝐼 ̅ − 𝑖1 𝑟 + 𝐺 = −𝑎 + (1 − 𝑏)(𝑦 − 𝑇) + 𝑇