Scatter plots Samenvattingen, Aantekeningen en Examens
Op zoek naar een samenvatting over Scatter plots? Op deze pagina vind je 285 samenvattingen over Scatter plots.
Alle 285 resultaten
Sorteer op
 Populair
-
MIP2602 assignment 4 (DETAILED ANSWERS) 2023 (225269) -DUE 25 August 2023
- Tentamen (uitwerkingen) • 20 pagina's • 2023
-
- €2,56
- 18x verkocht
- + meer info
MIP2602 assignment 4 (DETAILED ANSWERS) 2023 () -DUE 25 August 2023 100% TRUSTED workings, explanations and solutions. For assistance call or whatsapp us on +25477 954 0132 . Question 1 1.1 What type(s) of data are best for using the following? 1.1.1 A stem-and-leaf plot (2) 1.1.2 A bar chart (2) 1.1.3 Pie chart (2) 1.1.4 Scatter plot (2) 1.1.5 Line graph (2) 1.1.6 A histogram (1) 1.1.7 Box-and-whisker plot (1) 1.2 How is the bar graph better than the pictograph? (4) 1.3 Whe...
 Populair
-
Test Bank for Thinking Mathematically, 8th Edition by Robert F. Blitzer
- Tentamen (uitwerkingen) • 513 pagina's • 2024 Populair
-
- €37,30
- 3x verkocht
- + meer info
Test Bank for Thinking Mathematically 8e 8th Edition by Robert F. Blitzer. Full Chapters test bank are included. Chapter 1 to 14 Problem Solving and Critical Thinking 1.1 Inductive and Deductive Reasoning 1.2 Estimation, Graphs, and Mathematical Models 1.3 Problem Solving Set Theory 2.1 Basic Set Concepts 2.2 Subsets 2.3 Venn Diagrams and Set Operations 2.4 Set Operations and Venn Diagrams with Three Sets 2.5 Survey Problems Logic 3.1 Statements, Negations, and Quantified Statement...
-
IAAO 300: Complete Course Review Questions and Answers 100% Pass
- Tentamen (uitwerkingen) • 10 pagina's • 2023
-
Ook in voordeelbundel
-
- €9,44
- 4x verkocht
- + meer info
IAAO 300: Complete Course Review Questions and Answers 100% Pass What is the main difference between single property appraisal and mass appraisal? 1. Group vs Particular 2. Mass Appraisal emphasizes standardized and statistical quality control features In the Appraisal Process, "Define the valuation problem" does not include which of the following: a. Define the Value to be developed b. Identify limiting conditions or limitations c. Date of the value d. Competitive properties e. Identify...
-
Gizmo Scatter plot Answer Key./Trends in Scatter Plots Answer Key
- Tentamen (uitwerkingen) • 8 pagina's • 2023
-
- €9,34
- + meer info
Gizmo Scatter plot Answer Key./Trends in Scatter Plots Answer Key Vocabulary: correlation, scatter plot, slope, trend line, y-intercept Prior Knowledge Questions (Do these BEFORE using the Gizmo.) [Note: The purpose of these questions is to activate prior knowledge and get students thinking. Students who do not already know the answers will benefit from the class discussion.] A school nurse records the age and height of each student she sees in a week. Then she makes a scatter plot ...
-
IAAO 311 Review Questions and Answers 100% Pass
- Tentamen (uitwerkingen) • 20 pagina's • 2023
-
Ook in voordeelbundel
-
- €9,44
- 2x verkocht
- + meer info
IAAO 311 Review Questions and Answers 100% Pass What is a requirement of both single-property and mass appraisal? Uses three basic approaches to value What is the first step in the mass appraisal process? definition of the problem List the three types of data that must be collected in analyzing the market. General data Specific data Comparative data Identifying supply and demand factors that best explain values in a specific market, and expressing them in an equation is called _______________...
-
Business Statistics and Analytics in Practice 9th Edition Bowerman Test Bank
- Tentamen (uitwerkingen) • 1963 pagina's • 2022
-
- €15,80
- 2x verkocht
- + meer info
Student name:__________ TRUE/FALSE - Write 'T' if the statement is true and 'F' if the statement is false. 1) A stem-and-leaf display is a graphical portrayal of a data set that shows the data set's overall pattern of variation. ⊚ true ⊚ false 2) The relative frequency is the frequency of a class divided by the total number of measurements. ⊚ true ⊚ false 3) A bar chart is a graphic that can be used to depict qualitative data. ⊚ true ⊚ false 4) Stem-and-leaf displays and dot plo...
-
MATH 225N Week 8 Assignment Linear Regression Equations | Questions and Answer elaborations | Already GRADED A
- Tentamen (uitwerkingen) • 30 pagina's • 2022
-
- €10,38
- 1x verkocht
- + meer info
Question: Annie owns a tutoring service. For each tutoring session, she charges $75 plus $35 per hour of work. A linear equation that expresses the total amount of money Annie earns per tutoring sessi on is y=75+35x. What are the independent and dependent variables? What is the y-intercept and the slope? Question: George is an avid plant lover and is concerned about the lack of daffodils that grow in his backyard. He finds the growth of the daffodils, G, is dependent on the percent of aluminum m...

-
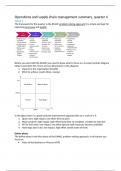
Supply chain and management International Business year 2
- Samenvatting • 25 pagina's • 2023
-
- €7,92
- 1x verkocht
- + meer info
In this document the different phases within supply chain management are discussed. Also different models are discussed: audit cycle, KPI tree, impact effort matrix, weighted decision matrix, 5 whys analysis, fishbone diagram, Yamazumi dashboard, Spaghetti diagram, layout warehouse, layout store, layout factory, time series plots, histogram, bar and pie charts, scatter plots, Pareto chart, define project charter, DMAIC
-
SOA PA Exam QUESTIONS AND ANSWERS
- Tentamen (uitwerkingen) • 21 pagina's • 2023
-
Ook in voordeelbundel
-
- €11,80
- + meer info
What to examine when assessing the bivariate relationship between a Factor predictor variable and a binary target variable? - Answer- A table to asses (with rows as factor levels) the mean probabilities, counts of observations of each factor, and counts of each observation of each binary target. What to examine when assessing the bivariate relationship between a Continuous predictor variable and a binary target variable? - Answer- - A graph with separate histograms for a continuous variable, ...
-
MCB 150 Final Exam Study Guide | 100% Correct | Verified | Latest Update 2024 | 25 Pages
- Tentamen (uitwerkingen) • 25 pagina's • 2023
-
- €16,52
- + meer info
What are the bonds and their strengths in order? - Covalent Ionic Hydrogen Van der Waal (LDF) Line Graphs are - best for displaying continuous quantitative data Scatter Plots are - for identifying correlations between two variables Bar Graphs are - for displaying discrete categories of data Histograms are - are for displaying contiguous data grouped into ranges of value List the following in order from smallest to largest ecosystem cells molecule/macromolecule organs population a...

Hoe heeft hij dat gedaan? Door zijn samenvatting te verkopen op Stuvia. Probeer het zelf eens! Ontdek alles over verdienen op Stuvia


