Tentamen (uitwerkingen)
MATH 1280 Self-Quiz Unit 3 |MATH1280 Self-Quiz Module 3 (100%) – University of the People
Beoordeling
Verkocht
-
Pagina's
11
Cijfer
A
Geüpload op
22-02-2021
Geschreven in
2020/2021
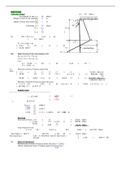
MATH 1280 Self-Quiz Unit 3 (100%) – University of the People Grade 10.00 out of 10.00 (100%) Question 1 Correct Question text In Figure A you will find box plots for three sets of data. In Figure B are the histograms for the same sets of data, but in a different order. Associate each box plot with its relative histogram. Figure A: Figure B:
Meer zien
Lees minder
Instelling
Vak
Oeps! We kunnen je document nu niet laden. Probeer het nog eens of neem contact op met support.

Geschreven voor
- Instelling
- Other
- Vak
- Math 1280 (MATH1280)
Alle documenten voor dit vak (8)
Documentinformatie
- Geüpload op
- 22 februari 2021
- Aantal pagina's
- 11
- Geschreven in
- 2020/2021
- Type
- Tentamen (uitwerkingen)
- Bevat
- Vragen en antwoorden
Onderwerpen
-
using the data
-
determine which one
-
math 1280 self quiz unit 3 100 – university of the people
-
the distribution is skewed to the left true or false
-
and without computing the mean and the median
€12,29
Krijg toegang tot het volledige document:
100% tevredenheidsgarantie
Direct beschikbaar na je betaling
Lees online óf als PDF
Geen vaste maandelijkse kosten