Quantitative and Design Methods in
Business Research
Introduction
Basis concepts of Multivariate Data Analysis
After this lecture, you should be able to do the following:
1. Explain what multivariate analysis is and when its application is appropriate.
2. Define and discuss the specific techniques included in multivariate analysis.
3. Determine which multivariate technique is appropriate for a specific research problem.
4. Discuss the nature of measurement scales and their relationship to multivariate techniques.
5. Describe the conceptual and statistical issues inherent in multivariate analyses
Multivariate Data Analysis comprises all statistical methods that simultaneously analyze multiple
measurements on each individual or object under investigation.
Motivation:
- Measurement
- Explanation & Prediction
- Hypothesis Testing
Basic Concepts
- Measurement scales
o Nonmetric
o Metric
- Measurement and measurement error
- Statistical inference
- Types of techniques
Types of Data and Measurement Scales
Measurement Scales
- Nonmetric
o Nominal – size of number is not related to the amount of the characteristic being
measured
o Ordinal – larger numbers indicate more (or less) of the characteristic measured, but
not how much more (or less).
, - Metric
o Interval – contains ordinal properties, and in addition, there are equal differences
between scale points.
o Ratio – contains interval scale properties, and in addition, there is a natural zero
point.
- The level of measurement is critical in determining the appropriate multivariate technique to
use!
Measurement Error
- All variables have some error.
- Measurement error = distorts observed relationships and makes multivariate techniques less
powerful.
- Researchers use summated scales, for which several variables are summed or averaged
together to form a composite representation of a concept.
You should correct the systematic error and then take the
mean: you will receive the right results
Reliability = absence of random measurement error
Validity = you measure what you want to measure
In addressing measurement error, researchers evaluate
two important characteristics of measurement:
- Reliability: the observed variable’s degree of
precision (reproducibility of results) and thus the
lack of random measurement error.
- Validity: the degree to which a measure
accurately represents what it is supposed to.
Statistical Significance and Power
- Type I error, or α, is the probability of rejecting the null hypothesis when it is true.
- Type II error, or β, is the probability of failing to reject the null hypothesis when it is false.
- Power, or 1-β, is the probability of rejecting the null hypothesis when it is false
- Effect size: the actual magnitude of the effect of interest (e.g., the difference between means
or the correlation between variables).
, - Alpha (α): as α is set at smaller levels, power decreases. Typically, α = .05.
- Sample size: as sample size increases, power increases. With very large sample sizes, even
very small effects can be statistically significant, raising the issue of practical significance vs.
statistical significance.
Statistical Power Analysis
- Researchers should design the study to achieve a power level of .80 at the desired
significance level.
- More stringent significance levels (e.g., .01 instead of .05) require larger samples to achieve
the desired power level.
- Conversely, power can be increased by choosing a less stringent alpha level (e.g., .10 instead
of .05).
- Smaller effect sizes always require larger sample sizes to achieve the desired power.
- Any increase in power is most likely achieved by increased sample size.
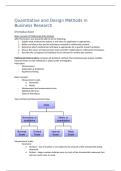
Types of Multivariate Techniques
Dependence techniques:
- A variable or set of variables is identified as the dependent variable to be predicted or
explained by other variables known as independent variables.
- Examples:
o Multiple regression*
o Logistic Regression
o Analysis of Variance (ANOVA) and Covariance (ANCOVA)*
o Conjoint Analysis
o Canonical Correlation
o Structural Equation Modeling (SEM)*
Interdependence techniques:
- They involve the simultaneous analysis of all variables in the set, without distinction between
dependent variables and independent variables.
- Examples:
, o Exploratory factor analysis*
o Principal component analysis*
o Cluster analysis
o Multidimensional scaling (perceptual mapping)
o Correspondence analysis
Selecting a Multivariate Technique
- What type of relationship is being examined – dependence or interdependence?
- Dependence relationship: How many variables are being predicted?
o What is the measurement scale of the dependent variable?
o What is the measurement scale of the predictor variable?
- Interdependence relationship: Are you examining relationships between variables,
respondents, or objects?
Factor analysis
Factor analysis analyzes the structure of the interrelationships among a large number of variables to
determine a set of common underlying dimensions (factors).
Higher eigenvalue = factor explains more variance.
Multiple Regression Analysis
A single metric dependent variable is predicted by several metric independent variables
Business Research
Introduction
Basis concepts of Multivariate Data Analysis
After this lecture, you should be able to do the following:
1. Explain what multivariate analysis is and when its application is appropriate.
2. Define and discuss the specific techniques included in multivariate analysis.
3. Determine which multivariate technique is appropriate for a specific research problem.
4. Discuss the nature of measurement scales and their relationship to multivariate techniques.
5. Describe the conceptual and statistical issues inherent in multivariate analyses
Multivariate Data Analysis comprises all statistical methods that simultaneously analyze multiple
measurements on each individual or object under investigation.
Motivation:
- Measurement
- Explanation & Prediction
- Hypothesis Testing
Basic Concepts
- Measurement scales
o Nonmetric
o Metric
- Measurement and measurement error
- Statistical inference
- Types of techniques
Types of Data and Measurement Scales
Measurement Scales
- Nonmetric
o Nominal – size of number is not related to the amount of the characteristic being
measured
o Ordinal – larger numbers indicate more (or less) of the characteristic measured, but
not how much more (or less).
, - Metric
o Interval – contains ordinal properties, and in addition, there are equal differences
between scale points.
o Ratio – contains interval scale properties, and in addition, there is a natural zero
point.
- The level of measurement is critical in determining the appropriate multivariate technique to
use!
Measurement Error
- All variables have some error.
- Measurement error = distorts observed relationships and makes multivariate techniques less
powerful.
- Researchers use summated scales, for which several variables are summed or averaged
together to form a composite representation of a concept.
You should correct the systematic error and then take the
mean: you will receive the right results
Reliability = absence of random measurement error
Validity = you measure what you want to measure
In addressing measurement error, researchers evaluate
two important characteristics of measurement:
- Reliability: the observed variable’s degree of
precision (reproducibility of results) and thus the
lack of random measurement error.
- Validity: the degree to which a measure
accurately represents what it is supposed to.
Statistical Significance and Power
- Type I error, or α, is the probability of rejecting the null hypothesis when it is true.
- Type II error, or β, is the probability of failing to reject the null hypothesis when it is false.
- Power, or 1-β, is the probability of rejecting the null hypothesis when it is false
- Effect size: the actual magnitude of the effect of interest (e.g., the difference between means
or the correlation between variables).
, - Alpha (α): as α is set at smaller levels, power decreases. Typically, α = .05.
- Sample size: as sample size increases, power increases. With very large sample sizes, even
very small effects can be statistically significant, raising the issue of practical significance vs.
statistical significance.
Statistical Power Analysis
- Researchers should design the study to achieve a power level of .80 at the desired
significance level.
- More stringent significance levels (e.g., .01 instead of .05) require larger samples to achieve
the desired power level.
- Conversely, power can be increased by choosing a less stringent alpha level (e.g., .10 instead
of .05).
- Smaller effect sizes always require larger sample sizes to achieve the desired power.
- Any increase in power is most likely achieved by increased sample size.
Types of Multivariate Techniques
Dependence techniques:
- A variable or set of variables is identified as the dependent variable to be predicted or
explained by other variables known as independent variables.
- Examples:
o Multiple regression*
o Logistic Regression
o Analysis of Variance (ANOVA) and Covariance (ANCOVA)*
o Conjoint Analysis
o Canonical Correlation
o Structural Equation Modeling (SEM)*
Interdependence techniques:
- They involve the simultaneous analysis of all variables in the set, without distinction between
dependent variables and independent variables.
- Examples:
, o Exploratory factor analysis*
o Principal component analysis*
o Cluster analysis
o Multidimensional scaling (perceptual mapping)
o Correspondence analysis
Selecting a Multivariate Technique
- What type of relationship is being examined – dependence or interdependence?
- Dependence relationship: How many variables are being predicted?
o What is the measurement scale of the dependent variable?
o What is the measurement scale of the predictor variable?
- Interdependence relationship: Are you examining relationships between variables,
respondents, or objects?
Factor analysis
Factor analysis analyzes the structure of the interrelationships among a large number of variables to
determine a set of common underlying dimensions (factors).
Higher eigenvalue = factor explains more variance.
Multiple Regression Analysis
A single metric dependent variable is predicted by several metric independent variables