2021
Management Research
Methods 1
A SUMMARY FOR PRE-MASTER ACCOUNTANCY & CONTROL
(5 EC) / VERSION 1.2
,Index
Chapter 1. Data ....................................................................................................................................... 3
1.1 What is Data? .......................................................................................................................... 3
1.2 Level of Measurement ............................................................................................................ 4
1.2.1 Why is this relevant? ...................................................................................................... 4
1.3 Data collection ........................................................................................................................ 5
1.3.1 Representative ................................................................................................................ 5
1.3.2 Validity ............................................................................................................................ 5
1.3.3 Measurement error ........................................................................................................ 6
1.4 Data analysis ........................................................................................................................... 7
1.4.1 Location ........................................................................................................................... 7
1.4.2 Dispersion ....................................................................................................................... 7
1.4.3 Other properties ............................................................................................................. 8
1.4.4 Plotting Data ................................................................................................................... 9
Chapter 2. Probability ........................................................................................................................... 10
2.1 What’s probability? .............................................................................................................. 10
2.2 Relation between data and probability ............................................................................... 10
2.3 Categorical probability ......................................................................................................... 10
2.3.1 Univariate categorical probability distributions .......................................................... 10
2.3.2 Bivariate categorical probability distributions ............................................................ 11
2.3.3 Univariate numerical probability distributions ........................................................... 12
2.4 Q-Q-plots ............................................................................................................................... 13
2.4.1 Practical advice for using Q-Q-plots ............................................................................. 13
Chapter 3. Hypothesis Testing: Introduction & One-Sample T-test................................................ 15
3.1 Why we use hypothesis testing............................................................................................ 15
3.1.1 Illustration ..................................................................................................................... 15
3.1.2 Decision Making............................................................................................................ 15
3.1.3 Alternative approach: Critical Region .......................................................................... 15
3.2 What do we need for a hypothesis test? ............................................................................. 16
3.2.1 Example ......................................................................................................................... 16
3.3 Steps doing a Hypothesis test .............................................................................................. 16
3.3.1 Example ......................................................................................................................... 16
3.4 One-Sample T-test ................................................................................................................ 18
3.4.1 Example ......................................................................................................................... 18
3.5 Testing a mean ...................................................................................................................... 18
3.5.1 Example ......................................................................................................................... 19
,Chapter 4. Hypothesis Testing: Correlation and Association .............................................................. 20
4.1 All the Hypothesis tests ........................................................................................................ 20
4.2 Relationship between two numerical variables .................................................................. 20
4.2.1 Calculation......................................................................................................................... 20
4.2.2 Correlation Test ................................................................................................................ 21
4.3 Chi-square test ...................................................................................................................... 22
Chapter 5. Hypothesis Testing: Paired Sample T-test and Independent Sample t-test ..................... 24
5.1 Central limit Theorem........................................................................................................... 24
5.2 Independent Sample T-test (Two-sample T-test) ................................................................ 25
5.3 Paired Sample T-test ............................................................................................................. 26
Chapter 6. Overview and summary ..................................................................................................... 28
6.1 The Hypothesis Test .............................................................................................................. 28
6.1.1 Procedure ...................................................................................................................... 28
6.2 One-Sample T-test ................................................................................................................ 28
6.3 Independent Sample t-test................................................................................................... 29
6.4 Paired Samples t-test ............................................................................................................ 29
6.5 Levene’s test for equal variances ......................................................................................... 29
6.6 Kolmogorov Smirnov test ..................................................................................................... 29
6.7 Pearson correlation test. ...................................................................................................... 29
6.8 Chi-square test for dependency ........................................................................................... 30
6.9 Examples ............................................................................................................................... 30
6.9.1 Example 1 ...................................................................................................................... 30
6.9.2 Example 2 ...................................................................................................................... 30
6.9.3 Example 3 ...................................................................................................................... 30
6.9.4 Example 4 ...................................................................................................................... 30
6.9.5 Solutions for the Examples ........................................................................................... 31
, 3
Chapter 1. Data
To do research, we require data. Once we have data, we are able to do analysis. This is the reason we
are going to discuss the general terminology, concepts, principles and techniques of statistical
analysis. We will do most the research with the software SPSS.
1.1 What is Data?
Most people think about numbers when thinking about data. However, data can also be words or
any other information. The only difference here is that every kind of data requires different statistical
techniques to analyze this data. For example, your name and gender can be data.
Data has a fixed structure because this way we know what belongs to what. To do this we look at the
difference between variables and units. Variables are properties that is being measured, for
example, your age and name. These are your properties. When you do analysis, you look at variables
at different people or cases. Those are units. When we look at name, we can measure it over
different units.
This means that:
Units – Cases like case number or Names of different people.
Properties – This is being measured of the units.
Structures – If we look at name, we can measure it over different units.
Lets do an example
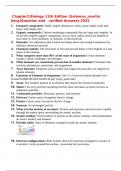
Consider this case: “Consider bank transfers as stated in the table you can see below. These bank
transfers have to be corrected, adjusted or rejected. In any case, every case has a case number. Also,
every payment has a sender-id, type (Like Annually or One Time Transfer). Lastly, there is the time
where the case is open. Once the bank transfer came in, the time started because then the bank
collected the data (Time open). The time pending is when the bank waits for the third party input and
can’t influence the time. The total time is when adding these two together. The Number of Pending
Iterations is the number that shows how many times it went from one partner to the other.
Case no. Sender-ID Type Total Time Time open Time No. of
pending pending
iterations
EX04001 386 AN 29.73 20.8 8.93 3
EX04020 7535 OX 6.83 5.54 1.29 2
EX04030 3577 NU 6.86 6.86 0.00 0
EX04035 3546 NU 6.93 4.77 2.16 1
EX04065 3656 IC 19.81 0.28 19.52 4
EX04150 2895 SN 5.70 5.70 0.00 0
EX04820 3589 AN 7.63 6.34 1.29 1
EX04950 7595 NU 6.84 6.84 0.00 0
EX05200 85401 OX 13.55 1.60 11.94 2
When we look at what we did before, we can acknowledge that the unit is a case. There is a total of 9
measured units. For each unit, we have measured several variables. These variables are the
properties of the units. Each column represents one variable and each row (except the first one with
the titles) represents one unit.
Every property leads back to the case. This is the reason why the case is the unit. When we talk
about a unit, we mean the experimental unit. What is the data about? In this particular case, we have
cases and from each case we can look at the variables. This is an important structure, which is
required when using the software SPSS.
, 1.2 Level of Measurement
When we have data, we have to know how much information we are able to gain. We can distinguish
this in two categories, which are: “Categorical data” and “Numerical data”. This is important
because categorical data requires different figures, statistical tools to be analyzed, than numerical
data. Also, it is important to distinguish how much information we can get from these. This is the
reason why we split these categories into sub-categories:
• Categorical data (Figures: Circle Diagram, Bar Diagram)
o Binary data: Here we have two outcomes, for example: ”yes or no” / “dead or alive.”
o Nominal data: Here we have more than two outcomes, which does not have an
order, for example: “Omnivore, vegetarian or vegan.”
o Ordinal data: Here we have more than two outcomes, which does have an order, for
example: “Small, Medium and Large.”
• Numerical Data (Figures: Histogram, Boxplot)
o Discrete data: This is a number that is an absolute without anything in between, for
example: “1” or “2”. It can’t be 1.5 or 2.2 etc.
o Continuous data: This is a number that can be anything. This means it can also be
something between: “1” and “2”. For example, length can be 145.6cm.
When we go from “Binary data” down to “Continuous data”, we gain more information the more we
go down. For example, binary information gives less information than continuous information. A
good example: “I know whether my shirt is small, medium or large (Binary data). I know a little bit
about the size of the person I am dealing with. However, if I know the person body length
(Continuous data), I know much more about that person because the information is more precise.
The advantage of this more precise information is that we need less data to give an good estimate.”
When we have continuous data and we want to combine several data ranges together, it is possible:
• Body length less than 160 CM → Small
• Body length between 160 CM and 180 CM → Medium
• Body length above 180 CM → Large
Do note you can’t do the opposite.
1.2.1 Why is this relevant?
This information is important for your thesis. At the end of your master study, you are going to write
a thesis about a topic you choose. This is why you have to know how to do research. There are
different types of data, where we need different techniques.
As you know, there are different types of data, where different techniques are required for each. The
lower the amount of information in your data, the larger your sample has to be. To illustrate this lets
say we are going to throw a dart. To start off you will have binary data, two outcomes: a good and
bad region on the dartboard. You need a large amount of observations to get trustworthy data.
When we have more outcomes, you need less observation to be able to distinguish the units.
When we talk about amount of observations, it is most likely to be:
• Binary numbers needs at least 300 observations
• Ordinal numbers needs somewhere between 30-300 observations
• Numerical numbers needs at least 30
Now we know the different types of data, lets look back at table we made before. What are the types
of data for all these variables? (Please think about it as an exercise)
Management Research
Methods 1
A SUMMARY FOR PRE-MASTER ACCOUNTANCY & CONTROL
(5 EC) / VERSION 1.2
,Index
Chapter 1. Data ....................................................................................................................................... 3
1.1 What is Data? .......................................................................................................................... 3
1.2 Level of Measurement ............................................................................................................ 4
1.2.1 Why is this relevant? ...................................................................................................... 4
1.3 Data collection ........................................................................................................................ 5
1.3.1 Representative ................................................................................................................ 5
1.3.2 Validity ............................................................................................................................ 5
1.3.3 Measurement error ........................................................................................................ 6
1.4 Data analysis ........................................................................................................................... 7
1.4.1 Location ........................................................................................................................... 7
1.4.2 Dispersion ....................................................................................................................... 7
1.4.3 Other properties ............................................................................................................. 8
1.4.4 Plotting Data ................................................................................................................... 9
Chapter 2. Probability ........................................................................................................................... 10
2.1 What’s probability? .............................................................................................................. 10
2.2 Relation between data and probability ............................................................................... 10
2.3 Categorical probability ......................................................................................................... 10
2.3.1 Univariate categorical probability distributions .......................................................... 10
2.3.2 Bivariate categorical probability distributions ............................................................ 11
2.3.3 Univariate numerical probability distributions ........................................................... 12
2.4 Q-Q-plots ............................................................................................................................... 13
2.4.1 Practical advice for using Q-Q-plots ............................................................................. 13
Chapter 3. Hypothesis Testing: Introduction & One-Sample T-test................................................ 15
3.1 Why we use hypothesis testing............................................................................................ 15
3.1.1 Illustration ..................................................................................................................... 15
3.1.2 Decision Making............................................................................................................ 15
3.1.3 Alternative approach: Critical Region .......................................................................... 15
3.2 What do we need for a hypothesis test? ............................................................................. 16
3.2.1 Example ......................................................................................................................... 16
3.3 Steps doing a Hypothesis test .............................................................................................. 16
3.3.1 Example ......................................................................................................................... 16
3.4 One-Sample T-test ................................................................................................................ 18
3.4.1 Example ......................................................................................................................... 18
3.5 Testing a mean ...................................................................................................................... 18
3.5.1 Example ......................................................................................................................... 19
,Chapter 4. Hypothesis Testing: Correlation and Association .............................................................. 20
4.1 All the Hypothesis tests ........................................................................................................ 20
4.2 Relationship between two numerical variables .................................................................. 20
4.2.1 Calculation......................................................................................................................... 20
4.2.2 Correlation Test ................................................................................................................ 21
4.3 Chi-square test ...................................................................................................................... 22
Chapter 5. Hypothesis Testing: Paired Sample T-test and Independent Sample t-test ..................... 24
5.1 Central limit Theorem........................................................................................................... 24
5.2 Independent Sample T-test (Two-sample T-test) ................................................................ 25
5.3 Paired Sample T-test ............................................................................................................. 26
Chapter 6. Overview and summary ..................................................................................................... 28
6.1 The Hypothesis Test .............................................................................................................. 28
6.1.1 Procedure ...................................................................................................................... 28
6.2 One-Sample T-test ................................................................................................................ 28
6.3 Independent Sample t-test................................................................................................... 29
6.4 Paired Samples t-test ............................................................................................................ 29
6.5 Levene’s test for equal variances ......................................................................................... 29
6.6 Kolmogorov Smirnov test ..................................................................................................... 29
6.7 Pearson correlation test. ...................................................................................................... 29
6.8 Chi-square test for dependency ........................................................................................... 30
6.9 Examples ............................................................................................................................... 30
6.9.1 Example 1 ...................................................................................................................... 30
6.9.2 Example 2 ...................................................................................................................... 30
6.9.3 Example 3 ...................................................................................................................... 30
6.9.4 Example 4 ...................................................................................................................... 30
6.9.5 Solutions for the Examples ........................................................................................... 31
, 3
Chapter 1. Data
To do research, we require data. Once we have data, we are able to do analysis. This is the reason we
are going to discuss the general terminology, concepts, principles and techniques of statistical
analysis. We will do most the research with the software SPSS.
1.1 What is Data?
Most people think about numbers when thinking about data. However, data can also be words or
any other information. The only difference here is that every kind of data requires different statistical
techniques to analyze this data. For example, your name and gender can be data.
Data has a fixed structure because this way we know what belongs to what. To do this we look at the
difference between variables and units. Variables are properties that is being measured, for
example, your age and name. These are your properties. When you do analysis, you look at variables
at different people or cases. Those are units. When we look at name, we can measure it over
different units.
This means that:
Units – Cases like case number or Names of different people.
Properties – This is being measured of the units.
Structures – If we look at name, we can measure it over different units.
Lets do an example
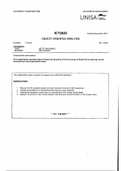
Consider this case: “Consider bank transfers as stated in the table you can see below. These bank
transfers have to be corrected, adjusted or rejected. In any case, every case has a case number. Also,
every payment has a sender-id, type (Like Annually or One Time Transfer). Lastly, there is the time
where the case is open. Once the bank transfer came in, the time started because then the bank
collected the data (Time open). The time pending is when the bank waits for the third party input and
can’t influence the time. The total time is when adding these two together. The Number of Pending
Iterations is the number that shows how many times it went from one partner to the other.
Case no. Sender-ID Type Total Time Time open Time No. of
pending pending
iterations
EX04001 386 AN 29.73 20.8 8.93 3
EX04020 7535 OX 6.83 5.54 1.29 2
EX04030 3577 NU 6.86 6.86 0.00 0
EX04035 3546 NU 6.93 4.77 2.16 1
EX04065 3656 IC 19.81 0.28 19.52 4
EX04150 2895 SN 5.70 5.70 0.00 0
EX04820 3589 AN 7.63 6.34 1.29 1
EX04950 7595 NU 6.84 6.84 0.00 0
EX05200 85401 OX 13.55 1.60 11.94 2
When we look at what we did before, we can acknowledge that the unit is a case. There is a total of 9
measured units. For each unit, we have measured several variables. These variables are the
properties of the units. Each column represents one variable and each row (except the first one with
the titles) represents one unit.
Every property leads back to the case. This is the reason why the case is the unit. When we talk
about a unit, we mean the experimental unit. What is the data about? In this particular case, we have
cases and from each case we can look at the variables. This is an important structure, which is
required when using the software SPSS.
, 1.2 Level of Measurement
When we have data, we have to know how much information we are able to gain. We can distinguish
this in two categories, which are: “Categorical data” and “Numerical data”. This is important
because categorical data requires different figures, statistical tools to be analyzed, than numerical
data. Also, it is important to distinguish how much information we can get from these. This is the
reason why we split these categories into sub-categories:
• Categorical data (Figures: Circle Diagram, Bar Diagram)
o Binary data: Here we have two outcomes, for example: ”yes or no” / “dead or alive.”
o Nominal data: Here we have more than two outcomes, which does not have an
order, for example: “Omnivore, vegetarian or vegan.”
o Ordinal data: Here we have more than two outcomes, which does have an order, for
example: “Small, Medium and Large.”
• Numerical Data (Figures: Histogram, Boxplot)
o Discrete data: This is a number that is an absolute without anything in between, for
example: “1” or “2”. It can’t be 1.5 or 2.2 etc.
o Continuous data: This is a number that can be anything. This means it can also be
something between: “1” and “2”. For example, length can be 145.6cm.
When we go from “Binary data” down to “Continuous data”, we gain more information the more we
go down. For example, binary information gives less information than continuous information. A
good example: “I know whether my shirt is small, medium or large (Binary data). I know a little bit
about the size of the person I am dealing with. However, if I know the person body length
(Continuous data), I know much more about that person because the information is more precise.
The advantage of this more precise information is that we need less data to give an good estimate.”
When we have continuous data and we want to combine several data ranges together, it is possible:
• Body length less than 160 CM → Small
• Body length between 160 CM and 180 CM → Medium
• Body length above 180 CM → Large
Do note you can’t do the opposite.
1.2.1 Why is this relevant?
This information is important for your thesis. At the end of your master study, you are going to write
a thesis about a topic you choose. This is why you have to know how to do research. There are
different types of data, where we need different techniques.
As you know, there are different types of data, where different techniques are required for each. The
lower the amount of information in your data, the larger your sample has to be. To illustrate this lets
say we are going to throw a dart. To start off you will have binary data, two outcomes: a good and
bad region on the dartboard. You need a large amount of observations to get trustworthy data.
When we have more outcomes, you need less observation to be able to distinguish the units.
When we talk about amount of observations, it is most likely to be:
• Binary numbers needs at least 300 observations
• Ordinal numbers needs somewhere between 30-300 observations
• Numerical numbers needs at least 30
Now we know the different types of data, lets look back at table we made before. What are the types
of data for all these variables? (Please think about it as an exercise)