Chapter 1
Data and Statistics
Learning Objectives
1. Obtain an appreciation for the breadth of statistical applications in business and economics.
2. Understand the meaning of the terms elements, variables, and observations as they are used in
statistics.
3. Obtain an understanding of the difference between categorical, quantitative, cross-sectional, and
time series data.
4. Learn about the sources of data for statistical analysis both internal and external to the firm.
5. Be aware of how errors can arise in data.
6. Know the meaning of descriptive statistics and statistical inference.
7. Be able to distinguish between a population and a sample.
8. Understand the role a sample plays in making statistical inferences about the population.
9. Know the meaning of the terms analytics, big data and data mining.
10. Be aware of ethical guidelines for statistical practice.
,Solutions:
1. Statistics can be referred to as numerical facts. In a broader sense, statistics is the field of study
dealing with the collection, analysis, presentation, and interpretation of data.
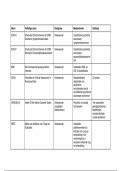
2. a. The ten elements are the ten tablet computers.
b. Five variables: Cost ($), Operating System, Display Size (inches), Battery Life (hours), CPU
Manufacturer
c. Categorical variables: Operating System and CPU Manufacturer
Quantitative variables: Cost ($), Display Size (inches), and Battery Life (hours)
d.
Variable Measurement Scale
Cost ($) Ratio
Operating System Nominal
Display Size (inches) Ratio
Battery Life (hours) Ratio
CPU Manufacturer Nominal
3. a. Average cost = 5829/10 = $582.90
b. Average cost with a Windows operating system = 3616/5 = $723.20
Average cost with an Android operating system = 1714/4 = $428.5
The average cost with a Windows operating system is much higher.
c. 2 of 10 or 20% use a CPU manufactured by TI OMAP.
d. 4 of 10 or 40% use an Android operating system.
4. a. There are eight elements in this data set; each element corresponds to one of the eight models of
cordless telephones.
b. Categorical variables: Voice Quality and Handset on Base
Quantitative variables: Price, Overall Score, and Talk Time
c. Price – ratio measurement
Overall Score – interval measurement
Voice Quality – ordinal measurement
Handset on Base – nominal measurement
Talk Time – ratio measurement
5. a. Average Price = 545/8 = $68.13
b. Average Talk Time = 71/8 = 8.875 hours
c. Percentage rated Excellent: 2 of 8 2/8 = .25, or 25%
4-2
,6. a. Categorical
b. Quantitative
c. Categorical
d. Quantitative
e. Quantitative
7. a. Since there are five choices, the response is a categorical response.
b. The five responses are the labels for the customer responses. A nominal scale is being used.
8. a. 762
b. Categorical
c. Percentages
d. .67(762) = 510.54
510 or 511 respondents said they want the amendment to pass.
9. a. The population is employed individuals in the United States aged 25–29.
b. Have you earned a bachelor’s degree (or higher)?
c. Since the response is yes or no, the response is categorical.
10. a. Categorical
b. Percentages
c. 44 of 1080 respondents or approximately 4% strongly agree with allowing drivers of motor vehicles
to talk on a hand-held cell phone while driving.
d. 165 of the 1080 respondents or 15% of said they somewhat disagree and 741 or 69% said they
strongly disagree. Thus, there does not appear to be general support for allowing drivers of motor
vehicles to talk on a hand-held cell phone while driving.
11. a. Since the respondents answer with some time interval, the response is categorical.
b. .53(1503) = 796.59 or approximately 797
c. .10(1503) = 150.3 or approximately 150
12. a. The population is all visitors coming to the state of Hawaii.
b. Since airline flights carry the vast majority of visitors to the state, the use of questionnaires for
passengers during incoming flights is a good way to reach this population. The questionnaire
actually appears on the back of a mandatory plants and animals declaration form that passengers
must complete during the incoming flight. A large percentage of passengers complete the visitor
information questionnaire.
4-3
© 2021 Cengage Learning. All Rights Reserved.
May not be scanned, copied or duplicated, or posted to a publicly accessible website, in whole or in part.
, c. Questions 1 and 4 provide quantitative data indicating the number of visits and the number of days
in Hawaii. Questions 2 and 3 provide categorical data indicating the categories of reason for the trip
and where the visitor plans to stay.
13. a. Facebook worldwide advertising revenue.
b. Quantitative
c. Time series
d. Facebook advertising revenue is increasing at an increasing rate over time.
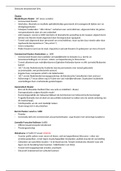
14. a. The graph of the time series follows:
Hertz Dollar Avis
350
300
250
Cars in Service (1000s)
200
150
100
50
0
Yea r 1 Yea r 2 Yea r 3 Yea r 4
b. In Year 1 and Year 2 Hertz was the clear market share leader. In Year 3 and Year 4 Hertz and Avis
have approximately the same market share. The market share for Dollar appears to be declining.
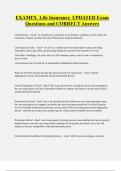
c. The bar chart for Year 4 is shown below.
4-4
Data and Statistics
Learning Objectives
1. Obtain an appreciation for the breadth of statistical applications in business and economics.
2. Understand the meaning of the terms elements, variables, and observations as they are used in
statistics.
3. Obtain an understanding of the difference between categorical, quantitative, cross-sectional, and
time series data.
4. Learn about the sources of data for statistical analysis both internal and external to the firm.
5. Be aware of how errors can arise in data.
6. Know the meaning of descriptive statistics and statistical inference.
7. Be able to distinguish between a population and a sample.
8. Understand the role a sample plays in making statistical inferences about the population.
9. Know the meaning of the terms analytics, big data and data mining.
10. Be aware of ethical guidelines for statistical practice.
,Solutions:
1. Statistics can be referred to as numerical facts. In a broader sense, statistics is the field of study
dealing with the collection, analysis, presentation, and interpretation of data.
2. a. The ten elements are the ten tablet computers.
b. Five variables: Cost ($), Operating System, Display Size (inches), Battery Life (hours), CPU
Manufacturer
c. Categorical variables: Operating System and CPU Manufacturer
Quantitative variables: Cost ($), Display Size (inches), and Battery Life (hours)
d.
Variable Measurement Scale
Cost ($) Ratio
Operating System Nominal
Display Size (inches) Ratio
Battery Life (hours) Ratio
CPU Manufacturer Nominal
3. a. Average cost = 5829/10 = $582.90
b. Average cost with a Windows operating system = 3616/5 = $723.20
Average cost with an Android operating system = 1714/4 = $428.5
The average cost with a Windows operating system is much higher.
c. 2 of 10 or 20% use a CPU manufactured by TI OMAP.
d. 4 of 10 or 40% use an Android operating system.
4. a. There are eight elements in this data set; each element corresponds to one of the eight models of
cordless telephones.
b. Categorical variables: Voice Quality and Handset on Base
Quantitative variables: Price, Overall Score, and Talk Time
c. Price – ratio measurement
Overall Score – interval measurement
Voice Quality – ordinal measurement
Handset on Base – nominal measurement
Talk Time – ratio measurement
5. a. Average Price = 545/8 = $68.13
b. Average Talk Time = 71/8 = 8.875 hours
c. Percentage rated Excellent: 2 of 8 2/8 = .25, or 25%
4-2
,6. a. Categorical
b. Quantitative
c. Categorical
d. Quantitative
e. Quantitative
7. a. Since there are five choices, the response is a categorical response.
b. The five responses are the labels for the customer responses. A nominal scale is being used.
8. a. 762
b. Categorical
c. Percentages
d. .67(762) = 510.54
510 or 511 respondents said they want the amendment to pass.
9. a. The population is employed individuals in the United States aged 25–29.
b. Have you earned a bachelor’s degree (or higher)?
c. Since the response is yes or no, the response is categorical.
10. a. Categorical
b. Percentages
c. 44 of 1080 respondents or approximately 4% strongly agree with allowing drivers of motor vehicles
to talk on a hand-held cell phone while driving.
d. 165 of the 1080 respondents or 15% of said they somewhat disagree and 741 or 69% said they
strongly disagree. Thus, there does not appear to be general support for allowing drivers of motor
vehicles to talk on a hand-held cell phone while driving.
11. a. Since the respondents answer with some time interval, the response is categorical.
b. .53(1503) = 796.59 or approximately 797
c. .10(1503) = 150.3 or approximately 150
12. a. The population is all visitors coming to the state of Hawaii.
b. Since airline flights carry the vast majority of visitors to the state, the use of questionnaires for
passengers during incoming flights is a good way to reach this population. The questionnaire
actually appears on the back of a mandatory plants and animals declaration form that passengers
must complete during the incoming flight. A large percentage of passengers complete the visitor
information questionnaire.
4-3
© 2021 Cengage Learning. All Rights Reserved.
May not be scanned, copied or duplicated, or posted to a publicly accessible website, in whole or in part.
, c. Questions 1 and 4 provide quantitative data indicating the number of visits and the number of days
in Hawaii. Questions 2 and 3 provide categorical data indicating the categories of reason for the trip
and where the visitor plans to stay.
13. a. Facebook worldwide advertising revenue.
b. Quantitative
c. Time series
d. Facebook advertising revenue is increasing at an increasing rate over time.
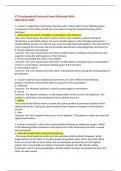
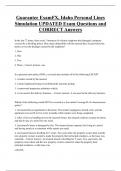
14. a. The graph of the time series follows:
Hertz Dollar Avis
350
300
250
Cars in Service (1000s)
200
150
100
50
0
Yea r 1 Yea r 2 Yea r 3 Yea r 4
b. In Year 1 and Year 2 Hertz was the clear market share leader. In Year 3 and Year 4 Hertz and Avis
have approximately the same market share. The market share for Dollar appears to be declining.
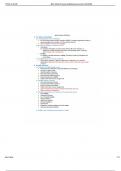
c. The bar chart for Year 4 is shown below.
4-4