Summary Management Research Methods part 2
Week 1
• Concept models are visual representations of relations between theoretical constructs
(variables) of interest
Variables can have different measurement scales:
1. Categorical: nominal, ordinal (subgroups are indicated by numbers) à is used when
categorize observations into different groups, based on certain criteria
2. Quantitative: discrete, interval, ratio (numerical scales, with equal distance between
values) à is used when measure constructs via scales on which, in theory, it is possible
to score any value
+ Including pseudo scales (once used in surveys 1 – 7) à then you say ‘it is a
(pseudo-)interval scale, treated as a quantitative variable’
ANOVA: analysis of Variance: statistically examines how much variability in our outcome
variable can be explained by our predictor variable
• Aim: find out whether mean scores of groups are significantly different
• Nature of the variables: OV is quantitative and PV is categorical (more than two)
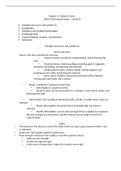
SSr: total variance in
data
SSm: variance explained SSn: unexplained
by model (groups) variances
Assumptions ANOVA:
• Variance is homogenous across groups (test similarity)
o Test of Homogeneity of variance by Levene’s statistic, whereby H0 : variances
are homogenous and HA : variances are heterogenous
o Use the row “Based on Mean”, so in this case a p-value of .271
• Residuals are normally distributed
• Groups are roughly equally sized
• Subject can only be in one group (between subjects design)
Steps to perform ANOVA:
1. Data suited for ANOVA? à check nature of variables and assumptions
2. Model as a whole makes sense? à perform F-test and calculate R2
3. Which group means differ? à perform post hoc or follow up test
R2: with SStotal = SSmodel + SS residual, it is possible to calculate the proportion of total
variance in the data (OV) that is explained by the model
1
, !"#$"%$&$'( *+,&"$-*. %( /0.*& 33/0.*&
• =
10'"& 2"#$"%$&$'( 33'0'"&
• The total sum of squares represents the total variability in scores on an outcome
variable
• If for example the R2 is 0.16, we can explain 16% of the variance in our model
F-test: to investigate if the group means differ
• The F statistic is a ration of the explained variance to the unexplained variance à it tells
us how much more explained variance we have compared to unexplained variance
4+,&"$-*. 2"#$"%$&$'( 6*'7**- 8#09, 2"#$"%$&$'(
• = à it is not possible to divide the model sum
5-*+,&"$-*. 2"#$"%$&$'( :$';$- 8#09, 2"#$"%$&$'(
of squares by residual sum of squares, because they are not based on the same
number of observations
o Solution: dived by degrees of freedom
§ DFmodel = k – 1 k = number of groups
§ DF residual = n – k
!!"#$%&
<*"- =>9"#*. /0.*&
o '("#$%&
!!)%*+$,-& = <*"- =>9"#*. #*=$.9"& à the higher the better
'()%*+$,-&
• If scores on a quantitative outcome vary more within groups than between groups, it is
unlikely that it matters which group you are in, regarding your score on the outcome
• H0 : 𝜇1 = 𝜇2 = …. à There is no difference in means across different categories
• HA : 𝜇I ≠ 𝜇j à There is a difference in means across different categories
o Notation for this test: H0 : all the means scores of groups on the outcome
variable are the same and HA : at least one of the mean scores of the groups on
the outcome variable differs from the others
• If for example the outcome is 11, we have 11 times more explained variance than
unexplained variance in our dataset
Example:
././.1
F- test: 2
3314./21 = 5.297
353
?@.@?B
R2: CDDB.EFG = 0.0617 (or 6.17%)
Means plot: to visualize which group means differ (graphically examine the patterns of the
differences in means)
• Obtain the different average scores of the groups on the outcome variable and see
which groups score higher or lower than which other groups
• Also possible: statistically test differences between groups by running multiple
comparisons (look at significance and direction of differences)
o H0 : meani - meanj = 0 and HA : meani - meanj ≠ 0 (for all groups separately)
2
Week 1
• Concept models are visual representations of relations between theoretical constructs
(variables) of interest
Variables can have different measurement scales:
1. Categorical: nominal, ordinal (subgroups are indicated by numbers) à is used when
categorize observations into different groups, based on certain criteria
2. Quantitative: discrete, interval, ratio (numerical scales, with equal distance between
values) à is used when measure constructs via scales on which, in theory, it is possible
to score any value
+ Including pseudo scales (once used in surveys 1 – 7) à then you say ‘it is a
(pseudo-)interval scale, treated as a quantitative variable’
ANOVA: analysis of Variance: statistically examines how much variability in our outcome
variable can be explained by our predictor variable
• Aim: find out whether mean scores of groups are significantly different
• Nature of the variables: OV is quantitative and PV is categorical (more than two)
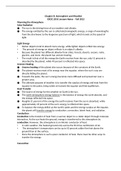
SSr: total variance in
data
SSm: variance explained SSn: unexplained
by model (groups) variances
Assumptions ANOVA:
• Variance is homogenous across groups (test similarity)
o Test of Homogeneity of variance by Levene’s statistic, whereby H0 : variances
are homogenous and HA : variances are heterogenous
o Use the row “Based on Mean”, so in this case a p-value of .271
• Residuals are normally distributed
• Groups are roughly equally sized
• Subject can only be in one group (between subjects design)
Steps to perform ANOVA:
1. Data suited for ANOVA? à check nature of variables and assumptions
2. Model as a whole makes sense? à perform F-test and calculate R2
3. Which group means differ? à perform post hoc or follow up test
R2: with SStotal = SSmodel + SS residual, it is possible to calculate the proportion of total
variance in the data (OV) that is explained by the model
1
, !"#$"%$&$'( *+,&"$-*. %( /0.*& 33/0.*&
• =
10'"& 2"#$"%$&$'( 33'0'"&
• The total sum of squares represents the total variability in scores on an outcome
variable
• If for example the R2 is 0.16, we can explain 16% of the variance in our model
F-test: to investigate if the group means differ
• The F statistic is a ration of the explained variance to the unexplained variance à it tells
us how much more explained variance we have compared to unexplained variance
4+,&"$-*. 2"#$"%$&$'( 6*'7**- 8#09, 2"#$"%$&$'(
• = à it is not possible to divide the model sum
5-*+,&"$-*. 2"#$"%$&$'( :$';$- 8#09, 2"#$"%$&$'(
of squares by residual sum of squares, because they are not based on the same
number of observations
o Solution: dived by degrees of freedom
§ DFmodel = k – 1 k = number of groups
§ DF residual = n – k
!!"#$%&
<*"- =>9"#*. /0.*&
o '("#$%&
!!)%*+$,-& = <*"- =>9"#*. #*=$.9"& à the higher the better
'()%*+$,-&
• If scores on a quantitative outcome vary more within groups than between groups, it is
unlikely that it matters which group you are in, regarding your score on the outcome
• H0 : 𝜇1 = 𝜇2 = …. à There is no difference in means across different categories
• HA : 𝜇I ≠ 𝜇j à There is a difference in means across different categories
o Notation for this test: H0 : all the means scores of groups on the outcome
variable are the same and HA : at least one of the mean scores of the groups on
the outcome variable differs from the others
• If for example the outcome is 11, we have 11 times more explained variance than
unexplained variance in our dataset
Example:
././.1
F- test: 2
3314./21 = 5.297
353
?@.@?B
R2: CDDB.EFG = 0.0617 (or 6.17%)
Means plot: to visualize which group means differ (graphically examine the patterns of the
differences in means)
• Obtain the different average scores of the groups on the outcome variable and see
which groups score higher or lower than which other groups
• Also possible: statistically test differences between groups by running multiple
comparisons (look at significance and direction of differences)
o H0 : meani - meanj = 0 and HA : meani - meanj ≠ 0 (for all groups separately)
2