,UNIT 1
SCIENTIFIC METHOD
Stage 1: Research Question
Based on observations, identifying problems and asking questions. It must be concise, specific, measurable and
manageable. Remember:
- Independent Variable: what you change
- Dependant Variable: what you are measuring
- Controlled Variable: does not change throughout experiment
Stage 2: Developing a Hypothesis
It is a prediction of the outcome of an experiment. Its based on what you think the results will be and its
has to be:
- a falsifiable statement
- describes the relationship between the two variables
- has to be objective
- contains all research variables
If the ( independent variable ) is increased/decreased then the ( dependant variable ) will as a result
increase/ decrease/stay the same. Give that the ( controlled variable ) remains the same.
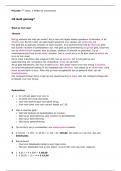
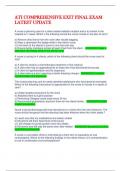
Remember it is important to repeat the investigation to make sure your results are accurate and precise.
Accurate Not Accurate Accurate Not Accurate
Precise Precise Not Precise Not Precise
-
-
:
-
: .. -
L
<
Stage 3: Method
Stage 4: Conduction of the Investigation
You can collect your results in various way such as:
- tables ( independent left column - dependant right column )
- lists
- pictures and diagrams
- graphs
But make sure for each of these you have a detailed heading and in tables no units of measurement are allowed
inside the table, only in the headings. You also have 2 different types of data. You have quantitive data -
continuous ( measured and expressed as a number ) and qualitative data - discontinuous ( can’t be expressed in
numbers and can be categorised ) so be careful as to what you use to represent your data.
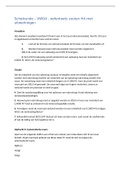
, Predicting in Science
Sometimes quantitive and qualitative data don’t always have a direct relationship but they do show a particular
trend or pattern ( increasing or decreasing ). We show this by connecting the dots on a scatter plot which turns
into a line graph. The line just shows the general shape of the data but it doesn’t have to go through all the dots
as long as it goes through most of them.
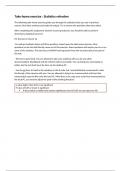
Here is a few tips and notes on graphs:
- If the line is diagonal it is a linear relationship / Indirectly Proportional Relationship ( one goes up and the
other goes down ).
- It is a Directly Proportional Relationship when both variables either increase or decrease.
- Outliers are when there is a random dot that falls out of the trend that is most probably a mistake.
- Interpolating: predict values within plotted values.
- Extrapolating: predict values outside of plotted values.
- Y-Axis = Dependant Variable
- X-Axis = Independant Variable
- Make sure spacing is even when plotting axis
Stage 5
This is when you conclude the scientific investigation by proving or disproving your hypothesis, answer the
research question and maybe any acknowledgments of ways to improve the investigation.
UNIT 2
Basic Building Blocks of Matter
Atom: smallest unit of an element that maintains the properties of the element.
Element: pure substance made up of 1 kind of atom.
Compound: 2 or more different elements bonded together
Neutron = no charge Atomic Mass
Proton = + charge 3
Electron = - charge Volume
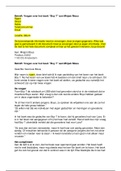
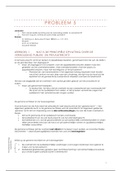
Structure of an Atom
Atom: they are spherically shaped with a small dense nucleus of positive charge surrounded by fast-moving
electrons traveling through the empty space around the nucleus.
Nucleus: it is positively charged. Made of protons and neutrons.
SCIENTIFIC METHOD
Stage 1: Research Question
Based on observations, identifying problems and asking questions. It must be concise, specific, measurable and
manageable. Remember:
- Independent Variable: what you change
- Dependant Variable: what you are measuring
- Controlled Variable: does not change throughout experiment
Stage 2: Developing a Hypothesis
It is a prediction of the outcome of an experiment. Its based on what you think the results will be and its
has to be:
- a falsifiable statement
- describes the relationship between the two variables
- has to be objective
- contains all research variables
If the ( independent variable ) is increased/decreased then the ( dependant variable ) will as a result
increase/ decrease/stay the same. Give that the ( controlled variable ) remains the same.
Remember it is important to repeat the investigation to make sure your results are accurate and precise.
Accurate Not Accurate Accurate Not Accurate
Precise Precise Not Precise Not Precise
-
-
:
-
: .. -
L
<
Stage 3: Method
Stage 4: Conduction of the Investigation
You can collect your results in various way such as:
- tables ( independent left column - dependant right column )
- lists
- pictures and diagrams
- graphs
But make sure for each of these you have a detailed heading and in tables no units of measurement are allowed
inside the table, only in the headings. You also have 2 different types of data. You have quantitive data -
continuous ( measured and expressed as a number ) and qualitative data - discontinuous ( can’t be expressed in
numbers and can be categorised ) so be careful as to what you use to represent your data.
, Predicting in Science
Sometimes quantitive and qualitative data don’t always have a direct relationship but they do show a particular
trend or pattern ( increasing or decreasing ). We show this by connecting the dots on a scatter plot which turns
into a line graph. The line just shows the general shape of the data but it doesn’t have to go through all the dots
as long as it goes through most of them.
Here is a few tips and notes on graphs:
- If the line is diagonal it is a linear relationship / Indirectly Proportional Relationship ( one goes up and the
other goes down ).
- It is a Directly Proportional Relationship when both variables either increase or decrease.
- Outliers are when there is a random dot that falls out of the trend that is most probably a mistake.
- Interpolating: predict values within plotted values.
- Extrapolating: predict values outside of plotted values.
- Y-Axis = Dependant Variable
- X-Axis = Independant Variable
- Make sure spacing is even when plotting axis
Stage 5
This is when you conclude the scientific investigation by proving or disproving your hypothesis, answer the
research question and maybe any acknowledgments of ways to improve the investigation.
UNIT 2
Basic Building Blocks of Matter
Atom: smallest unit of an element that maintains the properties of the element.
Element: pure substance made up of 1 kind of atom.
Compound: 2 or more different elements bonded together
Neutron = no charge Atomic Mass
Proton = + charge 3
Electron = - charge Volume
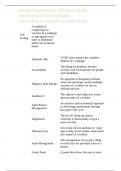
Structure of an Atom
Atom: they are spherically shaped with a small dense nucleus of positive charge surrounded by fast-moving
electrons traveling through the empty space around the nucleus.
Nucleus: it is positively charged. Made of protons and neutrons.