Political Science Research Methods II
Lecture 1. Introduction and refresher on inferential statistics
Regression analysis
- Can (in some form) be used to answer almost any quantitative research question, regardless of the
design
- Many simple methods (e.g., correlation coefficients or t-tests) are just small parts of the larger
method of the linear regression model
- Most advanced methods (e.g., multilevel models) are expansions of the linear regression model
Exam: multiple choice Q both numerical and non-numerical so abt calculating sth and interpreting the
result & abt factual knowledge
Population mean → if everyone writes an exam, then the population is everyone who took the exam
(157 students).
Let's imagine the average grade is 7.2. Then you might wonder abt the variation / dispersion of the grades.
Low dispersion means that everyone has exactly a 7.2 & high dispersion means that 50% has a 4.4 and
50% a 10. You express the amount of variation as a standard deviation / a variance.
Lets imagine the standard dev of 157 students is 1.4. But in research you usually don't have info abt the
entire population, so you need a sample. Inferential stats is about making inferences about a population
based on a sample.
If the prof starts grading the exams by randomly drawing some exams from the pile. After 5 exams the
grade is 5 then he could get worried that the grade average of all 157 students is a non-passing grade.
The big paradox of regular stats → So… you would want to know based on this sample (n = 5), what is
the chance that the average grade is lower than 5.5? But u cant answer this so… if the grade average of
all 157 students would be a passing grade (5.5), what would be the chance/probability that I would draw
a sample with an average of 5 or lower? Then you need a null hypothesis and an alternative one. Then
you can calculate the p-value.
In this case, the p-value will indicate the probability that you would draw a sample with a grade average
of 5.0 or lower while the actual grade average in the population is 5.5. You can find it in the table after
you know the t-value. If the actual grade average of all students would be a 5.5, there would still be a
probability of p = 0.29 (29% chance) that you would draw a sample of 5 students with an average of 5 or
lower. This p-value is greater than the commonly accepted significance level of α = 0.05. We cannot
reject the null-hypothesis.
1
,Conclusion: Based on the first five exams (the sample) that I graded, I simply cannot know yet whether
the grade average of all 157 students (the population) will be a passing grade or not!
Confidence interval
Now that I have concluded that the grade average of all 157 PSRM2 students may or may not be a passing
grade, I may want to know a bit more about what at least I can conclude from the first 5 exams. Here, a
confidence interval will be helpful. A confidence interval indicates all values of a null-hypothesis that
would not be rejected by the current sample mean.
In this case: for what population means would the probability of drawing a sample with an average of 5.0
still be greater than 5% (α = 0.05). This range is always the sample mean ±1.96 times the standard error.
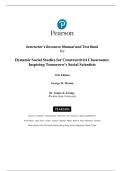
The lower bound of the 95% confidence interval is always the
sample mean minus 1.96 times the standard error. The upper
bound of the 95% confidence interval is always the sample
mean plus 1.96 times the standard error. So in the case of the
example, the confidence interval ranges between 3.8 (5.0 –
1.96*0.63) and 6.2 (5.0 + 1.96*0.63).
Conclusion: As long as the grade average of all 157 PSRM2 students is somewhere between 3.8 and 6.2,
it is still quite conceivable (>5%) that you would draw a sample of 5 exams with an average of 5.0. Based
on this you can kind of assume that the average grade in the population is
probably between 3.8 and 6.2 (but that is not technically speaking a
correct interpretation!!!)
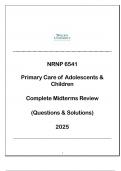
The population/sample distribution
The distribution of all 157 grades is the graph. The average here was 7.2,
the stand dev was 1.4.
The sampling distribution
Just like this, you can also imagine a similar distribution of all samples of 5
exams that you could draw. The mean of this sampling distribution is still 7.2,
but the standard deviation of this distribution is 0.63 (the standard error!)
→ Central limit theorem: With a sufficient sample size (roughly n >30), the
sampling distribution always follows the normal distribution
2
, Lecture 2. Simple regression (??.02.25)
What is regression analysis? It's about “predicting” values on a y-variable based on 1 or more
x-variables.
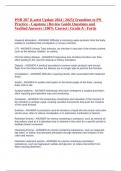
By trying to “predict” one variable (democracy) based on
scores on another variable (GDP per capita) we can find out
what the association between political phenomena looks like.
Explanatory purpose: Informative about causal relationship
(but correlation does not imply causation!): Could wealth
be a cause of the quality of democracy?
Descriptive purpose: Even without a causal relation, it is
interesting in its own right to know that poverty and
authoritarianism often go together
The simple linear regression
Predicted values: values on Y for each case
based on the estimated model → Ŷi = b0 +
b1X1
Observed values: values on Y for each case
that we actually observe in the sample → Yi =
b0 + b1 Xi + ε1
The differences between the observed values (Y i ) and the predicted values (Ŷ i ) are called residuals →
Yi - Ŷi = εi
Its called “simple” bc we have only 1 independent variable X, “linear” bc the effect of X on Y can be
represented by a straight line – steepness of the line (slope) given by value of regression coefficient >>
we multiply the value of X of each case i by b1 (b1X i = b1*X i)
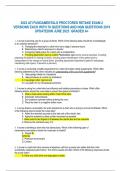
Example 1.
Hypothesis: The higher people’s income is, the more satisfied they will be satisfied with their
government
X = income
Y = satisfaction with government → Income – + → satisfaction with government
Yi = b0 + b1X i + ε → Satisfaction with government i = b0 + b1Incomei + ε i → Satisfaction with
government i = 4.07 + 0.167*Incomei + ε (you read the numbers from the graph)
3
, Example 2.
Hypothesis: The older people are, the less satisfied they will be with their government
Satisfaction with government i = 5.31 - 0.005*Agei + ε
- The predicted value on satisfaction with government decreases by 0.005 points for every
year older a person is
- The predicted value on satisfaction with government for a 33-years old person is 5.145 (5.31
– 0.005*33 = 5.145)
- For every 20 years older a person is, the predicted value on satisfaction with government
decreases by 0.1 points (0.005*20 = 0.1)
- The predicted value of satisfaction with the government for a person that is 0 years old is
5.31. The intercept always represents the estimated mean value of Y for X = 0
How do you test the significance of regression coefficients?
Example: The higher people’s income is, the more satisfied they will be satisfied with their government
H0 = b1 = 0
Ha = b1 > 0
To test the statistical significance of the regression coefficients, we use the t-test → t = b1/SEb1
We can look up the t-value in t-distribution to determine p-value
P-value → The probability that you would have found the estimated coefficient for b1 (or an even larger
coefficient) in your sample if income and satisfaction with government would be completely unrelated in
the population. If p-value < α we can reject to null-hypothesis > The effect of X on Y is statistically
‘significant’
How do you interpret the SPSS-output for regression analysis?
4
Lecture 1. Introduction and refresher on inferential statistics
Regression analysis
- Can (in some form) be used to answer almost any quantitative research question, regardless of the
design
- Many simple methods (e.g., correlation coefficients or t-tests) are just small parts of the larger
method of the linear regression model
- Most advanced methods (e.g., multilevel models) are expansions of the linear regression model
Exam: multiple choice Q both numerical and non-numerical so abt calculating sth and interpreting the
result & abt factual knowledge
Population mean → if everyone writes an exam, then the population is everyone who took the exam
(157 students).
Let's imagine the average grade is 7.2. Then you might wonder abt the variation / dispersion of the grades.
Low dispersion means that everyone has exactly a 7.2 & high dispersion means that 50% has a 4.4 and
50% a 10. You express the amount of variation as a standard deviation / a variance.
Lets imagine the standard dev of 157 students is 1.4. But in research you usually don't have info abt the
entire population, so you need a sample. Inferential stats is about making inferences about a population
based on a sample.
If the prof starts grading the exams by randomly drawing some exams from the pile. After 5 exams the
grade is 5 then he could get worried that the grade average of all 157 students is a non-passing grade.
The big paradox of regular stats → So… you would want to know based on this sample (n = 5), what is
the chance that the average grade is lower than 5.5? But u cant answer this so… if the grade average of
all 157 students would be a passing grade (5.5), what would be the chance/probability that I would draw
a sample with an average of 5 or lower? Then you need a null hypothesis and an alternative one. Then
you can calculate the p-value.
In this case, the p-value will indicate the probability that you would draw a sample with a grade average
of 5.0 or lower while the actual grade average in the population is 5.5. You can find it in the table after
you know the t-value. If the actual grade average of all students would be a 5.5, there would still be a
probability of p = 0.29 (29% chance) that you would draw a sample of 5 students with an average of 5 or
lower. This p-value is greater than the commonly accepted significance level of α = 0.05. We cannot
reject the null-hypothesis.
1
,Conclusion: Based on the first five exams (the sample) that I graded, I simply cannot know yet whether
the grade average of all 157 students (the population) will be a passing grade or not!
Confidence interval
Now that I have concluded that the grade average of all 157 PSRM2 students may or may not be a passing
grade, I may want to know a bit more about what at least I can conclude from the first 5 exams. Here, a
confidence interval will be helpful. A confidence interval indicates all values of a null-hypothesis that
would not be rejected by the current sample mean.
In this case: for what population means would the probability of drawing a sample with an average of 5.0
still be greater than 5% (α = 0.05). This range is always the sample mean ±1.96 times the standard error.
The lower bound of the 95% confidence interval is always the
sample mean minus 1.96 times the standard error. The upper
bound of the 95% confidence interval is always the sample
mean plus 1.96 times the standard error. So in the case of the
example, the confidence interval ranges between 3.8 (5.0 –
1.96*0.63) and 6.2 (5.0 + 1.96*0.63).
Conclusion: As long as the grade average of all 157 PSRM2 students is somewhere between 3.8 and 6.2,
it is still quite conceivable (>5%) that you would draw a sample of 5 exams with an average of 5.0. Based
on this you can kind of assume that the average grade in the population is
probably between 3.8 and 6.2 (but that is not technically speaking a
correct interpretation!!!)
The population/sample distribution
The distribution of all 157 grades is the graph. The average here was 7.2,
the stand dev was 1.4.
The sampling distribution
Just like this, you can also imagine a similar distribution of all samples of 5
exams that you could draw. The mean of this sampling distribution is still 7.2,
but the standard deviation of this distribution is 0.63 (the standard error!)
→ Central limit theorem: With a sufficient sample size (roughly n >30), the
sampling distribution always follows the normal distribution
2
, Lecture 2. Simple regression (??.02.25)
What is regression analysis? It's about “predicting” values on a y-variable based on 1 or more
x-variables.
By trying to “predict” one variable (democracy) based on
scores on another variable (GDP per capita) we can find out
what the association between political phenomena looks like.
Explanatory purpose: Informative about causal relationship
(but correlation does not imply causation!): Could wealth
be a cause of the quality of democracy?
Descriptive purpose: Even without a causal relation, it is
interesting in its own right to know that poverty and
authoritarianism often go together
The simple linear regression
Predicted values: values on Y for each case
based on the estimated model → Ŷi = b0 +
b1X1
Observed values: values on Y for each case
that we actually observe in the sample → Yi =
b0 + b1 Xi + ε1
The differences between the observed values (Y i ) and the predicted values (Ŷ i ) are called residuals →
Yi - Ŷi = εi
Its called “simple” bc we have only 1 independent variable X, “linear” bc the effect of X on Y can be
represented by a straight line – steepness of the line (slope) given by value of regression coefficient >>
we multiply the value of X of each case i by b1 (b1X i = b1*X i)
Example 1.
Hypothesis: The higher people’s income is, the more satisfied they will be satisfied with their
government
X = income
Y = satisfaction with government → Income – + → satisfaction with government
Yi = b0 + b1X i + ε → Satisfaction with government i = b0 + b1Incomei + ε i → Satisfaction with
government i = 4.07 + 0.167*Incomei + ε (you read the numbers from the graph)
3
, Example 2.
Hypothesis: The older people are, the less satisfied they will be with their government
Satisfaction with government i = 5.31 - 0.005*Agei + ε
- The predicted value on satisfaction with government decreases by 0.005 points for every
year older a person is
- The predicted value on satisfaction with government for a 33-years old person is 5.145 (5.31
– 0.005*33 = 5.145)
- For every 20 years older a person is, the predicted value on satisfaction with government
decreases by 0.1 points (0.005*20 = 0.1)
- The predicted value of satisfaction with the government for a person that is 0 years old is
5.31. The intercept always represents the estimated mean value of Y for X = 0
How do you test the significance of regression coefficients?
Example: The higher people’s income is, the more satisfied they will be satisfied with their government
H0 = b1 = 0
Ha = b1 > 0
To test the statistical significance of the regression coefficients, we use the t-test → t = b1/SEb1
We can look up the t-value in t-distribution to determine p-value
P-value → The probability that you would have found the estimated coefficient for b1 (or an even larger
coefficient) in your sample if income and satisfaction with government would be completely unrelated in
the population. If p-value < α we can reject to null-hypothesis > The effect of X on Y is statistically
‘significant’
How do you interpret the SPSS-output for regression analysis?
4