ECONOMETRICS:
SUMMARY
@ECOsummaries
→ 20% discount
1
,Econometrics Summary 2020
Lecture 1 – The Nature of Econometrics and Economic Data
Video 1 – What is Econometrics? LG: 1,2,6
Traditional sources of economic data: getting raw data from surveys like GDP, PCI etc.
New sources of data: e.g. ‘’scanner data’’, ‘’business information systems (eBay, amazon)’’
A lot of data supply → we need guidance to connect all these data points to explain phenomena
Qualitative economic analysis: factors that influence economic relationships
e.g. ‘’Raising wages increase labour supply if substitution effects
dominate income effects’’
Quantitative economic analysis: how quantities move with one another
e.g. ‘’The LR elasticity of labour supply with respect to the wage is 0’’
Econometrics: unification of economics, mathematics and statistics
Video 2 –Empirical Economic Analysis LG: 6.1
Three elasticities: -infinite, 0 and infinite
Steps in empirical economic analysis
Step 1: Pose an important question
- concern social mechanisms (markets, firms, government taxes and families)
- answering an important question helps other economists and decision makers
Step 2: Embody it within an econometric model
- two or more economic variables
- parameters are unknown constants which quantitatively characterise the model
- rephrase your question in terms of the value of one or more parameters.
Yt – yt-1 = percentage, because logarithms
2
,Step 3: Collect informative data
- find data that measure your model’s variables
- document your data sources with URLs, bibliographic information etc.
- Transform the data if necessary to better the match between measurements and definition
- collect data and metadata
Step 4: Estimate model parameters
- Econometric methods combine observations to give good estimates of model parameter
values when individuals act on unrecorded information.
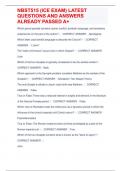
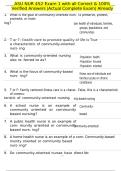
The red dots are the averages
Red dot 1 y-axis = LbarL
Red dot 1 x-axis = RbarL
Red dot 2 y-axis = LbarH
Red dot 2 x-axis = RbarH
Slope: -0.066 – 0.64x
Conclusion: as consumption rises relative to
income, consumption growth slows down
Because if the difference is low, it means you can live better with the means you have (hence higher
consumption, top left). The other way around is if the difference is high, that you need to cut
consumption (top right). When consumption is higher than GDP → consumption lowers. When
consumption is lower than GDP → consumption rises. (see line)
3
,Step 5: Evaluate estimates
* statistical testing
- The econometric errors make our parameters estimates random
- probability theory and statistics to access the range of parameter estimates we could get
by repeating the analysis with data created from different econometric errors.
- use the results to judge the informativeness of our econometric exercise
* assessment of economic importance
- the original economic question has
qualitative and quantitative aspects
- Does the obtained quantitative answer give
different implications that you would have
gotten by skipping the whole analysis and
assuming the opposite qualitative answer?
Video 3 – The structure of economic data
Time series: comparable measurements of one or more variables for a single observational unit over
multiple time periods.
- Observational Unit: A population of interest
- Variable: an ideal to be measured coupled with a measurement routine for sampling from the
observational unit and constructing an estimate of the ideal from that sample.
- Comparable: The variables are consistently defined and measured across time periods
Properties of Time series:
- Regular Time Series: The time between observations is fixed (e.g. quarterly GDP for NL)
- measurement frequency: hourly, daily, weekly, quarterly etc.
- Irregular Time Series: The time between observations varies (e.g. stock prices, the time is irregular)
- Instantaneously Sampled: A measurement made at an exact point in time
(e.g. the price of spa rood at albert heijn at 7:00 on Monday)
- Time Averaged: an average of a measurement made repeatedly over a specified time interval
(e.g. the average purchase price of spa rood at AH from 7:00-20:00 on Monday)
- Scalar: a single number
- Vector: two or more numbers (e.g. quarterly measurements of income and consumption.
4
, Cross Section: consists of comparable measurements of one or more variables for multiple
observational units made at the same time
- observational units (=families, companies etc.) are typically a sample from a larger population
- the sample is random
- survey designers might choose to oversample a population to improve the data’s informativeness
about a topic of interest
- response is typically voluntary
- unlike time series, the records in cross sectional data sets have no natural ordering.
Repeated Cross Section: Two or more cross sectional data sets with comparable variables with
different samples
- data set is called a ‘’wave’’
- Most cross sections are waves of repeated cross sections (e.g. Allbus)
- Each wave has a new random sample from the population
- No observational unit has a record in more than one of the cross-sectional data sets
Panel or Longitudinal: A cross section of time series, or a linked time series of cross sections
- The same sample of people again, so that you can see how individuals have changed
- An identifying variable links records from a single observational unit over time
- if every observational unit has a record in every wave, the panel is said to be balanced.
- if some observational units have missing records in some waves, the panel is unbalanced.
Panel vs. timeseries: panel has a lot of individuals and timeseries 1 or 2
Yit vs. Xit and Yt vs. Xt (i = number of individuals)
Video 4 – The structure of economic data LG: 5.2, 5.3
Ceteris Paribus: holding other things equal
*This is in dutch so ignore if you are not dutch*
104/118 → ybar 1 = som van alle kindren die treatment hebben gehad * hun lengte / aantal van die
kinderen
ybar0 = som van alle kindren die geen treatment hebben gehad (1-di, zodat als je 0 invult voo rDi dat
er 1 overblijft zodat het kind geteld word in de summatie) / aantal kinderen
Estimated effect for a child with Di = 0 Ybar1 – Yi
→ Ybar1 is het gemiddelde van kindren die de treatment gehad hebben – Yi (dit is de lengte van een
kind die GEEN treatment gehad hebben), zo kan je dus het verschil ongeveer inschatten.
Zelfde geld voor estimated effect for a child with Di = 1 (zijn lengte – het gemiddelde van kindren
zonder treatment, Ybar0)
105/118 → average treatmant effect = gemiddelde groep 1 – gemiddelde groep 2 = treatmant effect
- N is large, G(u,d) is het zelfde voor de 2 groepen, dus dezelfde invloeden die niet
worden mee gerekend (U) word voor elke groep kinderen verwaarloosd
Nog zeker een keer na kijken voor goed voorbeeld!
Natural experiments: when those receiving a treatment are randomly selected from the population
Treatment effect: difference between the data of 2 groups
5
SUMMARY
@ECOsummaries
→ 20% discount
1
,Econometrics Summary 2020
Lecture 1 – The Nature of Econometrics and Economic Data
Video 1 – What is Econometrics? LG: 1,2,6
Traditional sources of economic data: getting raw data from surveys like GDP, PCI etc.
New sources of data: e.g. ‘’scanner data’’, ‘’business information systems (eBay, amazon)’’
A lot of data supply → we need guidance to connect all these data points to explain phenomena
Qualitative economic analysis: factors that influence economic relationships
e.g. ‘’Raising wages increase labour supply if substitution effects
dominate income effects’’
Quantitative economic analysis: how quantities move with one another
e.g. ‘’The LR elasticity of labour supply with respect to the wage is 0’’
Econometrics: unification of economics, mathematics and statistics
Video 2 –Empirical Economic Analysis LG: 6.1
Three elasticities: -infinite, 0 and infinite
Steps in empirical economic analysis
Step 1: Pose an important question
- concern social mechanisms (markets, firms, government taxes and families)
- answering an important question helps other economists and decision makers
Step 2: Embody it within an econometric model
- two or more economic variables
- parameters are unknown constants which quantitatively characterise the model
- rephrase your question in terms of the value of one or more parameters.
Yt – yt-1 = percentage, because logarithms
2
,Step 3: Collect informative data
- find data that measure your model’s variables
- document your data sources with URLs, bibliographic information etc.
- Transform the data if necessary to better the match between measurements and definition
- collect data and metadata
Step 4: Estimate model parameters
- Econometric methods combine observations to give good estimates of model parameter
values when individuals act on unrecorded information.
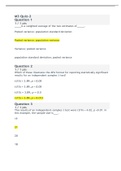
The red dots are the averages
Red dot 1 y-axis = LbarL
Red dot 1 x-axis = RbarL
Red dot 2 y-axis = LbarH
Red dot 2 x-axis = RbarH
Slope: -0.066 – 0.64x
Conclusion: as consumption rises relative to
income, consumption growth slows down
Because if the difference is low, it means you can live better with the means you have (hence higher
consumption, top left). The other way around is if the difference is high, that you need to cut
consumption (top right). When consumption is higher than GDP → consumption lowers. When
consumption is lower than GDP → consumption rises. (see line)
3
,Step 5: Evaluate estimates
* statistical testing
- The econometric errors make our parameters estimates random
- probability theory and statistics to access the range of parameter estimates we could get
by repeating the analysis with data created from different econometric errors.
- use the results to judge the informativeness of our econometric exercise
* assessment of economic importance
- the original economic question has
qualitative and quantitative aspects
- Does the obtained quantitative answer give
different implications that you would have
gotten by skipping the whole analysis and
assuming the opposite qualitative answer?
Video 3 – The structure of economic data
Time series: comparable measurements of one or more variables for a single observational unit over
multiple time periods.
- Observational Unit: A population of interest
- Variable: an ideal to be measured coupled with a measurement routine for sampling from the
observational unit and constructing an estimate of the ideal from that sample.
- Comparable: The variables are consistently defined and measured across time periods
Properties of Time series:
- Regular Time Series: The time between observations is fixed (e.g. quarterly GDP for NL)
- measurement frequency: hourly, daily, weekly, quarterly etc.
- Irregular Time Series: The time between observations varies (e.g. stock prices, the time is irregular)
- Instantaneously Sampled: A measurement made at an exact point in time
(e.g. the price of spa rood at albert heijn at 7:00 on Monday)
- Time Averaged: an average of a measurement made repeatedly over a specified time interval
(e.g. the average purchase price of spa rood at AH from 7:00-20:00 on Monday)
- Scalar: a single number
- Vector: two or more numbers (e.g. quarterly measurements of income and consumption.
4
, Cross Section: consists of comparable measurements of one or more variables for multiple
observational units made at the same time
- observational units (=families, companies etc.) are typically a sample from a larger population
- the sample is random
- survey designers might choose to oversample a population to improve the data’s informativeness
about a topic of interest
- response is typically voluntary
- unlike time series, the records in cross sectional data sets have no natural ordering.
Repeated Cross Section: Two or more cross sectional data sets with comparable variables with
different samples
- data set is called a ‘’wave’’
- Most cross sections are waves of repeated cross sections (e.g. Allbus)
- Each wave has a new random sample from the population
- No observational unit has a record in more than one of the cross-sectional data sets
Panel or Longitudinal: A cross section of time series, or a linked time series of cross sections
- The same sample of people again, so that you can see how individuals have changed
- An identifying variable links records from a single observational unit over time
- if every observational unit has a record in every wave, the panel is said to be balanced.
- if some observational units have missing records in some waves, the panel is unbalanced.
Panel vs. timeseries: panel has a lot of individuals and timeseries 1 or 2
Yit vs. Xit and Yt vs. Xt (i = number of individuals)
Video 4 – The structure of economic data LG: 5.2, 5.3
Ceteris Paribus: holding other things equal
*This is in dutch so ignore if you are not dutch*
104/118 → ybar 1 = som van alle kindren die treatment hebben gehad * hun lengte / aantal van die
kinderen
ybar0 = som van alle kindren die geen treatment hebben gehad (1-di, zodat als je 0 invult voo rDi dat
er 1 overblijft zodat het kind geteld word in de summatie) / aantal kinderen
Estimated effect for a child with Di = 0 Ybar1 – Yi
→ Ybar1 is het gemiddelde van kindren die de treatment gehad hebben – Yi (dit is de lengte van een
kind die GEEN treatment gehad hebben), zo kan je dus het verschil ongeveer inschatten.
Zelfde geld voor estimated effect for a child with Di = 1 (zijn lengte – het gemiddelde van kindren
zonder treatment, Ybar0)
105/118 → average treatmant effect = gemiddelde groep 1 – gemiddelde groep 2 = treatmant effect
- N is large, G(u,d) is het zelfde voor de 2 groepen, dus dezelfde invloeden die niet
worden mee gerekend (U) word voor elke groep kinderen verwaarloosd
Nog zeker een keer na kijken voor goed voorbeeld!
Natural experiments: when those receiving a treatment are randomly selected from the population
Treatment effect: difference between the data of 2 groups
5