C-11 Interpret graphed data part 1, 2, 3
Select data display that effectively
communicates relevant quantitative
relations Questions with Correct
Answers
To find out if you get better performance on the CBA learning module series in the
mornings or in evenings, you could use an alternating treatments design and plot your
correct and incorrect answer rates using
a. a bar graph w/ one bar for correct rate and one for incorrect rate in each condition
b. 2 pie charts, one for e/a condition
c. a semi-logarithmic plot (Celeration Chart) or other time series line graph
d. all above - ANSWERSa semi-logarithmic plot (Celeration Chart) or other time series
line graph
A time series graph (equal-interval or semi-logarithmic) of your bx
a. illustrates the story of what happened and how your bx changed
b. illustrates the qualitative aspects of your bx
c. can display levels and trends in your bx in 2-D, but require an additional axis (3-D) to
have any display of variability - ANSWERSillustrates the story of what happened and
how your bx changed
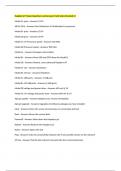
What type of graph is this?
a. semi-log
b. equal-interval
c. bar
d. cumulative record - ANSWERSSemi- log
The Y-axis is a log scale, in w/c equal distances on the graph are equal ratios (the
multiply distance is proportional) so going from 1 to 3 is the smae distance as from 10 to
30 or any other tripling, while the x-axis is equal interval. With one log scale and one
equal-interval scale, the graph is semi-log. You can see quickly that it's not a cumulative
graph (in w/c the daily # is added to the sum of all previous #'s ) b/ both Day 7 and Day
13 are below the previous data point. pg. 136-139
By convention, time on ABA line graphs is plotted on the
a. any of the axes
b. x-axis
c. z-axis
d. y-axis - ANSWERSb. x-axis
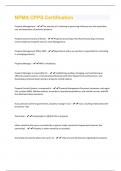
, What type of graph is this?
a. bar
b. equal-interval
c. cumulative record
d. semi-log - ANSWERSb. equal-interval
On both axes the additive distances are equal ( the distance on the graph from 10 to 20
is equal to the distance from 80 to 90 or any other 2 points that are 10 #'s apart) so this
is an equal-interval graph. It's not a cumulative graph, in which the daily # is added to
the sum of all previous #'s , both day 7 and day 13 are below the previous data point .
The goal of designing a single subject graph in ABA is to
a. allow the data to most clearly reveal the extent to w/c the dependent and independent
variables are related
b. convince the audience that change in the independent variable was followed with a
major change in the dependent variable
c. convince the audience that a change in the dependent variable was followed by a
major change in the independent variable - ANSWERSallow the data to most clearly
reveal the extent to w/c the dependent and independent variables are related
given appropriate permissions, a way for the BACB to see if ppl who practice the CBA
learning module series (LMS) to fluency get higher scores on the BCBA exam would be
to
a. calculate the correlation coefficient of the percent LMS fluency to the BCBA scores
for a group
b. plot people's BCBA score on the y-axis and their corresponding % LMS fluency on
the x-axis of a graph
c. plot people's BCBA scores on the x-axis and their corresponding % LMS fluency on
the y axis of a graph
d. all above - ANSWERSall of above correct
Given appropriate permissions, a way for the BACB to see if ppl who practice the CBA
learning module seies (LMS) to fluency get higher scores on the BCBA exam would be
to
a. plot the % LMS fluency on a standard celeration chart
b. plot ppl's bcba score on the y-axis and their corresponding lms percentage correct on
the x-axis of a graph
c. plot ppl's BCBA score on the x-axis and their corresponding % LMS fluency on the y-
axis of a graph
d. all above - ANSWERSplot ppl's BCBA score on the x-axis and their corresponding %
LMS fluency on the y-axis of a graph
Celeration charts, cumulative records, and other time-series graphs of behavior
a. may reveal underlying cyclical changes in bx that otherwise wouldn't be recognized
as part of a pattern
Select data display that effectively
communicates relevant quantitative
relations Questions with Correct
Answers
To find out if you get better performance on the CBA learning module series in the
mornings or in evenings, you could use an alternating treatments design and plot your
correct and incorrect answer rates using
a. a bar graph w/ one bar for correct rate and one for incorrect rate in each condition
b. 2 pie charts, one for e/a condition
c. a semi-logarithmic plot (Celeration Chart) or other time series line graph
d. all above - ANSWERSa semi-logarithmic plot (Celeration Chart) or other time series
line graph
A time series graph (equal-interval or semi-logarithmic) of your bx
a. illustrates the story of what happened and how your bx changed
b. illustrates the qualitative aspects of your bx
c. can display levels and trends in your bx in 2-D, but require an additional axis (3-D) to
have any display of variability - ANSWERSillustrates the story of what happened and
how your bx changed
What type of graph is this?
a. semi-log
b. equal-interval
c. bar
d. cumulative record - ANSWERSSemi- log
The Y-axis is a log scale, in w/c equal distances on the graph are equal ratios (the
multiply distance is proportional) so going from 1 to 3 is the smae distance as from 10 to
30 or any other tripling, while the x-axis is equal interval. With one log scale and one
equal-interval scale, the graph is semi-log. You can see quickly that it's not a cumulative
graph (in w/c the daily # is added to the sum of all previous #'s ) b/ both Day 7 and Day
13 are below the previous data point. pg. 136-139
By convention, time on ABA line graphs is plotted on the
a. any of the axes
b. x-axis
c. z-axis
d. y-axis - ANSWERSb. x-axis
, What type of graph is this?
a. bar
b. equal-interval
c. cumulative record
d. semi-log - ANSWERSb. equal-interval
On both axes the additive distances are equal ( the distance on the graph from 10 to 20
is equal to the distance from 80 to 90 or any other 2 points that are 10 #'s apart) so this
is an equal-interval graph. It's not a cumulative graph, in which the daily # is added to
the sum of all previous #'s , both day 7 and day 13 are below the previous data point .
The goal of designing a single subject graph in ABA is to
a. allow the data to most clearly reveal the extent to w/c the dependent and independent
variables are related
b. convince the audience that change in the independent variable was followed with a
major change in the dependent variable
c. convince the audience that a change in the dependent variable was followed by a
major change in the independent variable - ANSWERSallow the data to most clearly
reveal the extent to w/c the dependent and independent variables are related
given appropriate permissions, a way for the BACB to see if ppl who practice the CBA
learning module series (LMS) to fluency get higher scores on the BCBA exam would be
to
a. calculate the correlation coefficient of the percent LMS fluency to the BCBA scores
for a group
b. plot people's BCBA score on the y-axis and their corresponding % LMS fluency on
the x-axis of a graph
c. plot people's BCBA scores on the x-axis and their corresponding % LMS fluency on
the y axis of a graph
d. all above - ANSWERSall of above correct
Given appropriate permissions, a way for the BACB to see if ppl who practice the CBA
learning module seies (LMS) to fluency get higher scores on the BCBA exam would be
to
a. plot the % LMS fluency on a standard celeration chart
b. plot ppl's bcba score on the y-axis and their corresponding lms percentage correct on
the x-axis of a graph
c. plot ppl's BCBA score on the x-axis and their corresponding % LMS fluency on the y-
axis of a graph
d. all above - ANSWERSplot ppl's BCBA score on the x-axis and their corresponding %
LMS fluency on the y-axis of a graph
Celeration charts, cumulative records, and other time-series graphs of behavior
a. may reveal underlying cyclical changes in bx that otherwise wouldn't be recognized
as part of a pattern