DATA LITERACY D772 (NOT COMPLETE
YET ONLY THROUGH SECTION 2
LESSON 3.1) 119 QUESTIONS WITH
COMPLETE SOLUTIONS!!
1 of
118
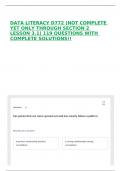
Definition
has points that are more spread out and less clearly follow a pattern.
Give this one a try later!
A perfect relationship (perfect A strong relationship (strong
correlation) correlation)
, A weak relationship No relationship at all (zero
(weak correlation) correlation)
Don't know?
2 of 118
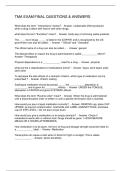
Definition
A researcher observes and records the eating habits and weight of a
group of individuals over a year to see if there is a relationship
between diet and weight gain.
Give this one a try later!
Observational Studies
Experiments (Example)
Sample Surveys Control group
Don't know?
3 of 118
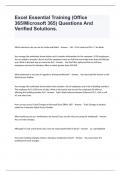
Definition
A smaller, more manageable group selected from the population to
represent the larger group.
,Give this one a try later!
Cluster Population
Sample Range
Don't know?
4 of 118
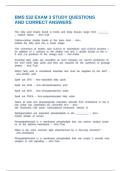
Definition
When we have a Q→Q (Quantitative to Quantitative) role-type
classification, a scatterplot.
Give this one a try later!
C→C Role-type Classification Q→Q Role-type Classification
C→Q Role-type Classification No Pattern (No Correlation)
Don't know?
, 5 of 118
Definition
means that one variable directly causes an effect in the other.
Give this one a try later!
A strong relationship (strong
No pattern (No correlation) correlation)...
Causal relationship (causation) Association
Don't know?
6 of 118
Definition
A researcher randomly assigns participants to two groups: one
group receives a new drug for high blood pressure, while the other
group receives an inactive treatment, also known as a placebo.
The researcher then compares the blood pressure readings of
the two groups to determine if the drug is effective.
Give this one a try later!
They might receive no treatment, or
they may receive what is referred Sample Surveys
to as a
YET ONLY THROUGH SECTION 2
LESSON 3.1) 119 QUESTIONS WITH
COMPLETE SOLUTIONS!!
1 of
118
Definition
has points that are more spread out and less clearly follow a pattern.
Give this one a try later!
A perfect relationship (perfect A strong relationship (strong
correlation) correlation)
, A weak relationship No relationship at all (zero
(weak correlation) correlation)
Don't know?
2 of 118
Definition
A researcher observes and records the eating habits and weight of a
group of individuals over a year to see if there is a relationship
between diet and weight gain.
Give this one a try later!
Observational Studies
Experiments (Example)
Sample Surveys Control group
Don't know?
3 of 118
Definition
A smaller, more manageable group selected from the population to
represent the larger group.
,Give this one a try later!
Cluster Population
Sample Range
Don't know?
4 of 118
Definition
When we have a Q→Q (Quantitative to Quantitative) role-type
classification, a scatterplot.
Give this one a try later!
C→C Role-type Classification Q→Q Role-type Classification
C→Q Role-type Classification No Pattern (No Correlation)
Don't know?
, 5 of 118
Definition
means that one variable directly causes an effect in the other.
Give this one a try later!
A strong relationship (strong
No pattern (No correlation) correlation)...
Causal relationship (causation) Association
Don't know?
6 of 118
Definition
A researcher randomly assigns participants to two groups: one
group receives a new drug for high blood pressure, while the other
group receives an inactive treatment, also known as a placebo.
The researcher then compares the blood pressure readings of
the two groups to determine if the drug is effective.
Give this one a try later!
They might receive no treatment, or
they may receive what is referred Sample Surveys
to as a