EUP1501
Assignment 3 Semester 1 2025
Unique #:
Due Date: 30 April 2025
Detailed solutions, explanations, workings
and references.
+27 81 278 3372
, SECTION A
COMPLETE ANSWER WITH STEP BY STEP GUIDELINES
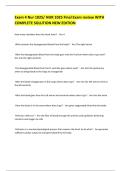
Column1 Column2 Column3 Column4 Column5 Column6 Column7 Column8
No Drone Model Sales Region Units Sold Unit Price Total Revenue Profit (%) Profit Amount
1 DJI Phantom 4 North America 5000 R1 200,00 R6 000 000,00 25% R1 500 000,00
2 Parrot Anafi Europe 3000 R800,00 R2 400 000,00 30% R720 000,00
3 DJI Mavic Air 2 Asia 7000 R1 000,00 R7 000 000,00 28% R1 960 000,00
4 Skydio 2 South America 2500 R1 500,00 R3 750 000,00 32% R1 200 000,00
5 Autel Evo II Africa 1800 R1 100,00 R1 980 000,00 27% R534 600,00
6 Sum R5 600,00 R21 130 000,00 R5 914 600,00
7 Average R1 120,00 R4 226 000,00 R1 182 920,00
8 Max R1 500,00 R7 000 000,00 R1 960 000,00
9 Min R800,00 R1 980 000,00 R534 600,00
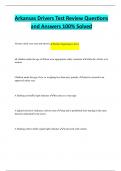
Total Revenue by Sales Region
R8 000 000,00
R7 000 000,00
R6 000 000,00
R5 000 000,00
R4 000 000,00
Total Revenue
R3 000 000,00
R2 000 000,00
R1 000 000,00
R0,00
North America Europe Asia South America Africa
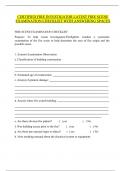
Market share of each drone model
Autel
Evo II
9%
DJI Phantom 4
Skydio 2
26%
20%
Parrot Anafi
12%
DJI Mavic Air 2
33%
Varsity Cube 2025 +27 81 278 3372
, STEP-BY-STEP GUIDELINE INSTRUCTIONS FOR SECTION A
Step 1: Create the Drone Sales Dataset
1. Open Microsoft Excel and create a blank spreadsheet.
2. Enter the column headers exactly as follows:
o Drone Model, Sales Region, Units Sold, Unit Price, Total Revenue,
Profit Margin (%), Profit Amount
3. Input the 5 rows of drone data as provided.
4. Leave rows for Sum, Average, Max, and Min under the dataset.
Step 2: Format Headers [2 marks]
Bold all column headers.
Select the headers:
o Click and drag to highlight all the column headers (e.g. “Drone Model”,
“Sales Region”, “Units Sold”, etc.).
Make the text bold:
o On the Home tab (in the Excel ribbon at the top),
o Click the “B” button in the Font group, or press Ctrl + B on your keyboard.
Change font size of headers to 12pt.
While the headers are still selected,
Locate the Font Size box in the same Home tab, usually next to the font name
(e.g., Calibri).
Varsity Cube 2025 +27 81 278 3372
Assignment 3 Semester 1 2025
Unique #:
Due Date: 30 April 2025
Detailed solutions, explanations, workings
and references.
+27 81 278 3372
, SECTION A
COMPLETE ANSWER WITH STEP BY STEP GUIDELINES
Column1 Column2 Column3 Column4 Column5 Column6 Column7 Column8
No Drone Model Sales Region Units Sold Unit Price Total Revenue Profit (%) Profit Amount
1 DJI Phantom 4 North America 5000 R1 200,00 R6 000 000,00 25% R1 500 000,00
2 Parrot Anafi Europe 3000 R800,00 R2 400 000,00 30% R720 000,00
3 DJI Mavic Air 2 Asia 7000 R1 000,00 R7 000 000,00 28% R1 960 000,00
4 Skydio 2 South America 2500 R1 500,00 R3 750 000,00 32% R1 200 000,00
5 Autel Evo II Africa 1800 R1 100,00 R1 980 000,00 27% R534 600,00
6 Sum R5 600,00 R21 130 000,00 R5 914 600,00
7 Average R1 120,00 R4 226 000,00 R1 182 920,00
8 Max R1 500,00 R7 000 000,00 R1 960 000,00
9 Min R800,00 R1 980 000,00 R534 600,00
Total Revenue by Sales Region
R8 000 000,00
R7 000 000,00
R6 000 000,00
R5 000 000,00
R4 000 000,00
Total Revenue
R3 000 000,00
R2 000 000,00
R1 000 000,00
R0,00
North America Europe Asia South America Africa
Market share of each drone model
Autel
Evo II
9%
DJI Phantom 4
Skydio 2
26%
20%
Parrot Anafi
12%
DJI Mavic Air 2
33%
Varsity Cube 2025 +27 81 278 3372
, STEP-BY-STEP GUIDELINE INSTRUCTIONS FOR SECTION A
Step 1: Create the Drone Sales Dataset
1. Open Microsoft Excel and create a blank spreadsheet.
2. Enter the column headers exactly as follows:
o Drone Model, Sales Region, Units Sold, Unit Price, Total Revenue,
Profit Margin (%), Profit Amount
3. Input the 5 rows of drone data as provided.
4. Leave rows for Sum, Average, Max, and Min under the dataset.
Step 2: Format Headers [2 marks]
Bold all column headers.
Select the headers:
o Click and drag to highlight all the column headers (e.g. “Drone Model”,
“Sales Region”, “Units Sold”, etc.).
Make the text bold:
o On the Home tab (in the Excel ribbon at the top),
o Click the “B” button in the Font group, or press Ctrl + B on your keyboard.
Change font size of headers to 12pt.
While the headers are still selected,
Locate the Font Size box in the same Home tab, usually next to the font name
(e.g., Calibri).
Varsity Cube 2025 +27 81 278 3372