D184 Standards-Based Assessment - OKM1 - Task 3
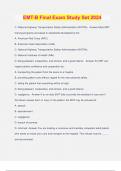
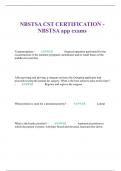
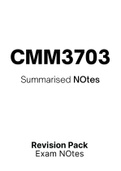
D184 Standards-Based Assessment - OKM1 - Task 3 A A1 Marzano Calculated Chart (Empower 2022) D184 Standards-Based Assessment - OKM1 - Task 3 A2 The summative proficiency scores are shown with the overall average for each student. The overall scores are also found as linear and power functions (Empower 2022). A3 Subgroup 1 Subgroup 2 Subgroup 3 Subgroup 4 Subgroup 5 Student 1 2.625 Student 1 2.625 Student 1 2.625 Student 2 2.5 Student 2 2.5 Student 2 2.5 Student 3 2.625 Student 3 2.625 Student 5 2.125 Student 4 2.875 Student 6 1.625 Student 6 1.625 Student 4 2.875 Student 7 1 Student 5 2.125 Student 12 3.5 Student 7 3.5 Student 6 1.625 Student 8 0.625 Student 10 3 Student 16 2.875 Student 8 2.875 Student 9 1 Student 10 3 Student 11 3.125 Student 19 2.375 Student 9 2.375 Student 13 2.875 Student 11 3.125 Student 12 3.5 Avg: 2.853 Avg: 2.604 Student 15 3.5 Student 12 3.5 Student 13 2.875 Student 17 2.5 Student 14 3.875 Student 14 3.875 Student 20 3 Student 16 2.875 Student 15 3.5 Avg: 2.513 Student 18 3.625 Student 16 2.875 Student 19 2.375 Student 17 2.5 Avg: 2.602 Student 18 3.625 Student 19 2.375 Student 20 3 Avg: 2.982 D184 Standards-Based Assessment - OKM1 - Task 3 B1 Assessment 1 Assessment 2 Assessment 3 Assessment 4 Assessment 5 Assessment 6 Assessment 7 Assessment 8 1.9 2.1 2.4 2.5 2.75 2.85 2.95 3.05 The whole-class average score increased with each assessment. This shows that, on average, most students improved with each assessment. Individually, students 1-3, 5, 6, 8, 12-15, 17, 18, and 20 showed an improvement in assessment scores and never a decrease. The data concludes that these students made positive progress in their learning goal. Students 1-3, 5, 6, and 17 earned proficiency on their final assessment. Students 12-15, 18, and 20 earned advanced on their final assessment. Student 8 earned 1.0 (up from a 0.0) on their final assessment. From the data, it would appear that Student 8 struggled with the topic from beginning to end. This student may have additional learning needs that include a 504 or IEP. Students 7, 9, and 10 scored the same on each assessment. Students 7 and 9 scored a 1.0 on each assessment. Student 10 scored a 3.0 on each assessment. It would appear that Students 7 and 9 struggled with the topic from the beginning to end and may have additional learning needs. Student 10 shows consistent proficiency and is right on target. Students 4, 11, 16, and 19 showed increases and decreases in assessment scores. Student 4 showed an increase from 2.0 to 3.0, then had one 4.0, before a decrease back to 3.0. This would not raise a red flag to me since there was only one test with a 4.0 score. Student 11’s scores are similar. They are all 3.0, except assessment 6. This is not alarming at all for me. Student 16 went from 2.0 to 3.0, then back down to 2.0. After that, they increased their score to 3.0, then 4.0, before dipping back down to 3.0. Student 19 scored a 0.0, then had an increase to 2.0, then 3.0. They then went back down to 2.0 before having several scores of 3.0.

Geschreven voor
- Instelling
- Western Governors University
- Vak
- WGU D184 Standards-Based Assessment
Documentinformatie
- Geüpload op
- 15 april 2025
- Aantal pagina's
- 7
- Geschreven in
- 2024/2025
- Type
- Tentamen (uitwerkingen)
- Bevat
- Vragen en antwoorden
Onderwerpen
-
d184
-
wgu d184
-
d184 standards based assessment
-
d184 standards based assessment okm1 task 3