Inhoudsopgave
Module 1 1
Wooclap 1
Tentamen vragen 2
Mock exam - zonder antwoorden 8
Module 2 11
Wooclap vragen 11
Tentamen 13
Mock exam - zonder antwoorden 18
Module 4 22
Wooclap questions 22
Tentamen 25
Mock exam - zonder antwoorden 28
Module 7 30
Wooclap 30
Mock exam - zonder antwoorden 32
,Module 1
Wooclap
Please select all that apply for error terms:
1. Theoretical relationship
2. Empirical relationship
3. Difference between observed values and estimated values
4. Difference between observed values and theoretical values
5. Used to test assumptions
6. Used to define assumptions
Please select all that apply for residuals:
1. Theoretical relationship
2. Empirical relationship
3. Difference between observed values and estimated values
4. Difference between observed values and theoretical values
5. Used to test assumptions
6. Used to define assumptions
Select all true statements
1. The theoretical relationship can never be observed
2. Observed data points are the best predictors for the theoretical relationship
3. BLUE means that residuals = error terms
4. A BLUE estimator has the smallest variance of all unbiased estimators
5. If an assumption is violated, OLS cannot be used anymore (True and False)
If you create a dummy variable for a categorical variable with k different categories,
how many dummy variables do you need to create and include in an OLS regression?
- k-1
- k
- k+1
- There is not enough information to answer this question.
What are methods to detect outliers and/or influential cases? Select all that apply.
- Scatterplot
- R²
- Standardised Residual
- DFFIT
- Least Squares Principle
- Cook’s distance
What are common characteristics of an outlier?
- Extreme value on the x axis
- Extreme value on the y axis
- Extreme residual
- Extreme R²
1
, - Extreme coefficient
- Large leverage
What are common characteristics of an influential case?
- Extreme value on the x axis
- Extreme value on the y axis
-
- Extreme residual
- Extreme R²
- Extreme coefficient
- Large leverage
Tentamen vragen
Mock exam – Module 1 (Smits)
A researcher would like to find out whether religion and socio-economic status of the family
and the background of individuals influences the educational level they are able to obtain.
She has a data set with information on 15,000 persons aged 15 and over with the following
variables: educational level, age, religion, and father’s socio-economic status.
● Educational level is measured with the number of years of education completed by
the respondents.
● Age is measured in years.
● Religion is measured by a categorical variable with four categories: (1) Catholic, (2)
Protestant, (3) Muslim, (4) Other.
● Father’s socio-economic status is measured by an interval scale based on his
occupation, running from 0 to 100, with 0 being lowest and 100 being highest status.
The researcher decides to run an OLS regression analysis with respondent’s years of
education completed as dependent variable and religion, age and father’s socio-economic
status as independent variables.
a. (5p) What does OLS in OLS regression mean?
Ordinary least squares, it refers to the way the model is estimated: the regression line is
chosen in such a way that the squared vertical distances of each point to the line are as
small as possible.
Religion is included in the model as a set of dummy variables.
b. (5p) What kind of coding of the dummy variables is most appropriate for this
variable? What would be the reference for these dummies?
As religion is a nominal variable (no order), effects coding is the most appropriate kind of
coding. In that case, the general mean is the reference.
The researcher hypothesizes that the effect of respondent’s age might differ between
younger and older respondents.
c (3p) Could you provide a plausible motivation for this hypothesis?
Nowadays people are longer learning (more and extra studies), so as a result, younger
people’s years of education completed is higher than older people.
2
, d (3p) How do you call such a relationship, in which the effect of a variable changes
over the range of that variable?
Interaction-effect. (parameters of the model should have the same value for all individuals)
e (4p) How do you test whether this hypothesis is correct?
By including an interaction-term and test whether this coefficient is significant. Or perform
a regression between one of the variables of the interaction-effect with the other
variables of the interaction-effect. A high R-squared can indicate an interaction-effect.
Perusal exam module 1
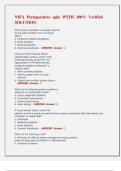
In the picture a partial regression
plot is shown. On top, the
distribution of 16 observations
around the OLS regression line is
shown. On the top right there are
two dots which are situated far from
the other observations. These two
dots have a high Lever value
compared to the other observations.
a. (2p) Explain what it means that
these observations have a high
Lever value.
They are located far from the centre of the other observations (on the x variable). [Because
of this, they have a strong influence on the their own fit].
b. (3p) Besides Lever, another important statistic of residual analysis is Cook. Explain
what is indicated by Cook. What is the difference between an observation with a high
and an observation with a low Cook value?
Cook’s distance D indicates the difference between beta’s estimated with and without
individual i. Hence: Influence of each individual on the estimations. A high Cook value
means an influential case (an observation that influences the regression coefficient
substantially, and hence should be considered for removal).
c. (4p) What can you say about the Cook value of the two upper right dots with the
relatively high Level value. Will their Cook value also be high compared to that value
of the other observations?
Even though they influence the direction of the regression line (the slope) substantially, their
Cook value will not be high. When one of them is removed, the other will still keep the
regression line in the same direction. Hence each of them alone does not determine the
slope, but together they do this very strongly.
d. (5p) What do you call a relationship, in which the effect of a variable changes over
the range of that variable.
Interaction-effect. This is, for example, the case when the effect of age on income differs for
male and female (gender).
3
Module 1 1
Wooclap 1
Tentamen vragen 2
Mock exam - zonder antwoorden 8
Module 2 11
Wooclap vragen 11
Tentamen 13
Mock exam - zonder antwoorden 18
Module 4 22
Wooclap questions 22
Tentamen 25
Mock exam - zonder antwoorden 28
Module 7 30
Wooclap 30
Mock exam - zonder antwoorden 32
,Module 1
Wooclap
Please select all that apply for error terms:
1. Theoretical relationship
2. Empirical relationship
3. Difference between observed values and estimated values
4. Difference between observed values and theoretical values
5. Used to test assumptions
6. Used to define assumptions
Please select all that apply for residuals:
1. Theoretical relationship
2. Empirical relationship
3. Difference between observed values and estimated values
4. Difference between observed values and theoretical values
5. Used to test assumptions
6. Used to define assumptions
Select all true statements
1. The theoretical relationship can never be observed
2. Observed data points are the best predictors for the theoretical relationship
3. BLUE means that residuals = error terms
4. A BLUE estimator has the smallest variance of all unbiased estimators
5. If an assumption is violated, OLS cannot be used anymore (True and False)
If you create a dummy variable for a categorical variable with k different categories,
how many dummy variables do you need to create and include in an OLS regression?
- k-1
- k
- k+1
- There is not enough information to answer this question.
What are methods to detect outliers and/or influential cases? Select all that apply.
- Scatterplot
- R²
- Standardised Residual
- DFFIT
- Least Squares Principle
- Cook’s distance
What are common characteristics of an outlier?
- Extreme value on the x axis
- Extreme value on the y axis
- Extreme residual
- Extreme R²
1
, - Extreme coefficient
- Large leverage
What are common characteristics of an influential case?
- Extreme value on the x axis
- Extreme value on the y axis
-
- Extreme residual
- Extreme R²
- Extreme coefficient
- Large leverage
Tentamen vragen
Mock exam – Module 1 (Smits)
A researcher would like to find out whether religion and socio-economic status of the family
and the background of individuals influences the educational level they are able to obtain.
She has a data set with information on 15,000 persons aged 15 and over with the following
variables: educational level, age, religion, and father’s socio-economic status.
● Educational level is measured with the number of years of education completed by
the respondents.
● Age is measured in years.
● Religion is measured by a categorical variable with four categories: (1) Catholic, (2)
Protestant, (3) Muslim, (4) Other.
● Father’s socio-economic status is measured by an interval scale based on his
occupation, running from 0 to 100, with 0 being lowest and 100 being highest status.
The researcher decides to run an OLS regression analysis with respondent’s years of
education completed as dependent variable and religion, age and father’s socio-economic
status as independent variables.
a. (5p) What does OLS in OLS regression mean?
Ordinary least squares, it refers to the way the model is estimated: the regression line is
chosen in such a way that the squared vertical distances of each point to the line are as
small as possible.
Religion is included in the model as a set of dummy variables.
b. (5p) What kind of coding of the dummy variables is most appropriate for this
variable? What would be the reference for these dummies?
As religion is a nominal variable (no order), effects coding is the most appropriate kind of
coding. In that case, the general mean is the reference.
The researcher hypothesizes that the effect of respondent’s age might differ between
younger and older respondents.
c (3p) Could you provide a plausible motivation for this hypothesis?
Nowadays people are longer learning (more and extra studies), so as a result, younger
people’s years of education completed is higher than older people.
2
, d (3p) How do you call such a relationship, in which the effect of a variable changes
over the range of that variable?
Interaction-effect. (parameters of the model should have the same value for all individuals)
e (4p) How do you test whether this hypothesis is correct?
By including an interaction-term and test whether this coefficient is significant. Or perform
a regression between one of the variables of the interaction-effect with the other
variables of the interaction-effect. A high R-squared can indicate an interaction-effect.
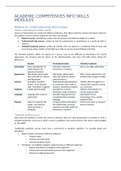
Perusal exam module 1
In the picture a partial regression
plot is shown. On top, the
distribution of 16 observations
around the OLS regression line is
shown. On the top right there are
two dots which are situated far from
the other observations. These two
dots have a high Lever value
compared to the other observations.
a. (2p) Explain what it means that
these observations have a high
Lever value.
They are located far from the centre of the other observations (on the x variable). [Because
of this, they have a strong influence on the their own fit].
b. (3p) Besides Lever, another important statistic of residual analysis is Cook. Explain
what is indicated by Cook. What is the difference between an observation with a high
and an observation with a low Cook value?
Cook’s distance D indicates the difference between beta’s estimated with and without
individual i. Hence: Influence of each individual on the estimations. A high Cook value
means an influential case (an observation that influences the regression coefficient
substantially, and hence should be considered for removal).
c. (4p) What can you say about the Cook value of the two upper right dots with the
relatively high Level value. Will their Cook value also be high compared to that value
of the other observations?
Even though they influence the direction of the regression line (the slope) substantially, their
Cook value will not be high. When one of them is removed, the other will still keep the
regression line in the same direction. Hence each of them alone does not determine the
slope, but together they do this very strongly.
d. (5p) What do you call a relationship, in which the effect of a variable changes over
the range of that variable.
Interaction-effect. This is, for example, the case when the effect of age on income differs for
male and female (gender).
3