Practical 6
Conducting a Survey
This practical will demonstrate the effects of weighting the data. Do not forget to screen the
data first! As a christmas gift the due date will be Monday January 6, 2019. If you have any
questions about how to perform the analyses/techniques of today's practical in SPSS, your
standard SPSS book will be a sufficient reference. For most students this has been the book
by Andy Field: Discovering Statistics Using SPSS.
In this practical there are a couple of questions to which the answers can be graded. These
questions are denoted by [HAND IN]. Hand it in no later than Monday January 6, 9AM,
by sending it to .
Your attendence at the practicals is required. However, if you are finished, you may leave.
All the best,
Anne Elevelt and Bella Struminskaya
1. Consider that you succeeded to draw a relatively large and perfectly random sample
from your target population. This means that with fully observed data (the 1517 cases
in the file unit_nonresponse_information.sav), the sample would be
representative for the population (no worries about bias and weighting). However, not
every respondent that was addressed was willing to fill in your questionnaire, so
unfortu- nately there is unit non-response. This possibly creates bias. Luckily, we still
have some basic information about the non-responders, so it is possible to weight back
to the full sample (representing the target population). The first part of the exercise is
about checking for the potential bias (a). In the second part (b), you are asked to
answer some research-questions correcting for this possible bias.
(a) Open the data file unit_nonresponse_information.sav. In this file you find all
available information about both responders and non- responders. Check variable and
value labels for all information about the variables. Examine if there are any
differences between responders and non-responders on region, sex, educ, race and
age.
There is a significant difference in age between respondents and not-respondents
t(1506)=2.646, p=.008. Non-responders are on average 2.45 years older than
responders.
There is no significant difference in education years between (non-)responders
(p=.924)
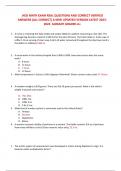
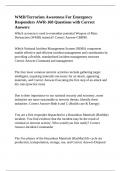
Non responders differ significantly from responders in sex (ChiSquare= 49.660,
p<.001). There are relatively more women respondents.
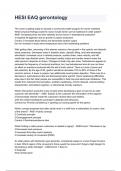
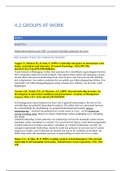
, Non respondents differ significantly in race, (Chisq=10.633, p=.005). non responders
are white more often, and black and other less often.
Non responders differ significantly in region, (Chisq=8.797, p=.012). Responders are
from the north east less often, and the other regions more often.
Crosstab
Respondent's Sex
Male Female Total
respons non-respons Count 351 326 677
% within respons 51,8% 48,2% 100,0%
% within Respondent's Sex 55,5% 37,2% 44,8%
respons Count 282 551 833
% within respons 33,9% 66,1% 100,0%
% within Respondent's Sex 44,5% 62,8% 55,2%
Total Count 633 877 1510
% within respons 41,9% 58,1% 100,0%
% within Respondent's Sex 100,0% 100,0% 100,0%
Crosstab
Race of Respondent
White Black Other Total
respons non-respons Count 584 81 12 677
% within respons 86,3% 12,0% 1,8% 100,0%
% within Race of 46,3% 40,7% 24,5% 44,8%
Respondent
respons Count 678 118 37 833
% within respons 81,4% 14,2% 4,4% 100,0%
% within Race of 53,7% 59,3% 75,5% 55,2%
Respondent
Total Count 1262 199 49 1510
% within respons 83,6% 13,2% 3,2% 100,0%
% within Race of 100,0% 100,0% 100,0% 100,0%
Respondent
(b) I selected two variables for weighting in subsequent questions: sex and race. Consider
the sample to be unbiased with respect to all other variables. Open the data file
Conducting a Survey
This practical will demonstrate the effects of weighting the data. Do not forget to screen the
data first! As a christmas gift the due date will be Monday January 6, 2019. If you have any
questions about how to perform the analyses/techniques of today's practical in SPSS, your
standard SPSS book will be a sufficient reference. For most students this has been the book
by Andy Field: Discovering Statistics Using SPSS.
In this practical there are a couple of questions to which the answers can be graded. These
questions are denoted by [HAND IN]. Hand it in no later than Monday January 6, 9AM,
by sending it to .
Your attendence at the practicals is required. However, if you are finished, you may leave.
All the best,
Anne Elevelt and Bella Struminskaya
1. Consider that you succeeded to draw a relatively large and perfectly random sample
from your target population. This means that with fully observed data (the 1517 cases
in the file unit_nonresponse_information.sav), the sample would be
representative for the population (no worries about bias and weighting). However, not
every respondent that was addressed was willing to fill in your questionnaire, so
unfortu- nately there is unit non-response. This possibly creates bias. Luckily, we still
have some basic information about the non-responders, so it is possible to weight back
to the full sample (representing the target population). The first part of the exercise is
about checking for the potential bias (a). In the second part (b), you are asked to
answer some research-questions correcting for this possible bias.
(a) Open the data file unit_nonresponse_information.sav. In this file you find all
available information about both responders and non- responders. Check variable and
value labels for all information about the variables. Examine if there are any
differences between responders and non-responders on region, sex, educ, race and
age.
There is a significant difference in age between respondents and not-respondents
t(1506)=2.646, p=.008. Non-responders are on average 2.45 years older than
responders.
There is no significant difference in education years between (non-)responders
(p=.924)
Non responders differ significantly from responders in sex (ChiSquare= 49.660,
p<.001). There are relatively more women respondents.
, Non respondents differ significantly in race, (Chisq=10.633, p=.005). non responders
are white more often, and black and other less often.
Non responders differ significantly in region, (Chisq=8.797, p=.012). Responders are
from the north east less often, and the other regions more often.
Crosstab
Respondent's Sex
Male Female Total
respons non-respons Count 351 326 677
% within respons 51,8% 48,2% 100,0%
% within Respondent's Sex 55,5% 37,2% 44,8%
respons Count 282 551 833
% within respons 33,9% 66,1% 100,0%
% within Respondent's Sex 44,5% 62,8% 55,2%
Total Count 633 877 1510
% within respons 41,9% 58,1% 100,0%
% within Respondent's Sex 100,0% 100,0% 100,0%
Crosstab
Race of Respondent
White Black Other Total
respons non-respons Count 584 81 12 677
% within respons 86,3% 12,0% 1,8% 100,0%
% within Race of 46,3% 40,7% 24,5% 44,8%
Respondent
respons Count 678 118 37 833
% within respons 81,4% 14,2% 4,4% 100,0%
% within Race of 53,7% 59,3% 75,5% 55,2%
Respondent
Total Count 1262 199 49 1510
% within respons 83,6% 13,2% 3,2% 100,0%
% within Race of 100,0% 100,0% 100,0% 100,0%
Respondent
(b) I selected two variables for weighting in subsequent questions: sex and race. Consider
the sample to be unbiased with respect to all other variables. Open the data file