TEST BANK
Introduction to Statistical
Investigations,
2nd Edition Nathan Tintle; Beth
L. Chance Chapters 1 - 11,
Complete
FOR INSTRUCTOR USE ONLY
d d d
,TABLE OF CONTENTS
d d d
Chapter 1 – Significance: How Strong is the Evidence
d d d d d d d d d
Chapter 2 –
d d
dGeneralization: How Broadly Do the Results Apply?
d d d d d d d
Chapter 3 – Estimation: How Large is the Effect?
d d d d d d d d d
Chapter 4 –
d d
dCausation: Can We Say What Caused the Effect?
d d d d d d d d
Chapter 5 – Comparing Two Proportions
d d d d d d
Chapter 6 – Comparing Two Means
d d d d d d
Chapter 7 – Paired Data: One Quantitative Variable
d d d d d d d d
Chapter 8 – Comparing More Than Two Proportions
d d d d d d d d
Chapter 9 – Comparing More Than Two Means
d d d d d d d d
Chapter 10 – Two Quantitative Variables
d d d d d d
Chapter 11 – Modeling Randomness
d d d d
FOR INSTRUCTOR USE ONLY
d d d
,Chapter 1 d
Note: TE = Text entry
ddd d d d TE-N = Text entry - d d d d
d NumericMa = Matching d d d MS = Multiple select
d d d
MC = Multiple choice
d d d TF = True-
d d
FalseE = Easy, M = Medium, H = Hard
d d d d d d d d d
CHAPTER 1 LEARNING OBJECTIVES d d d
CLO1-1: Use the chance model to determine whether an observed statistic is unlikely to occur.
d d d d d d d d d d d d d d
CLO1-2: Calculate and interpret a p-
d d d d d
value, and state the strength of evidence it provides againstthe null hypothesis.
d d d d d d d d d d d d
CLO1-
3: Calculate a standardized statistic for a single proportion and evaluate the str
d d d d d d d d d d d d
ength ofevidence it provides against a null hypothesis.
d d d d d d d d
CLO1-
4: Describe how the distance of the observed statistic from the parameter value spe
d d d d d d d d d d d d d
cifiedby the null hypothesis, sample size, and one- vs. two-
d d d d d d d d d d
sided tests affect the strength of evidence against the null hypothesis.
d d d d d d d d d d
CLO1-5: Describe how to carry out a theory-based, one-proportion z-test.
d d d d d d d d d
Section 1.1: Introduction to Chance Models d d d d d
LO1.1-1: Recognize the difference between parameters and statistics.
d d d d d d d
LO1.1-
2: Describe how to use coin tossing to simulate outcomes from a chance model of t
d d d d d d d d d d d d d d d
he ran-dom choice between two events.
d d d d d d
LO1.1-3: Use the One Proportion applet to carry out the coin tossing simulation.
d d d d d d d d d d d d
LO1.1-
4: Identify whether or not study results are statistically significant and whether
d d d d d d d d d d d d
or not thechance model is a plausible explanation for the data.
d d d d d d d d d d d
LO1.1-
5: Implement the 3S strategy: find a statistic, simulate results from a chance mo
d d d d d d d d d d d d d
del, andcomment on strength of evidence against observed study results happen
d d d d d d d d d d d
ing by chance alone.
d d d
LO1.1-
6: Differentiate between saying the chance model is plausible and the chance mode
d d d d d d d d d d d d
l is thecorrect explanation for the observed data.
d d d d d d d d
FOR INSTRUCTOR USE ONLY d d d
, 1-2 Test Bank for Introduction to Statistical Investigations, 2nd Edition
d d d d d d d d
Questions 1 through 4:
d d d
Do red uniform wearers tend to win more often than those wearing blue uniforms i
d d d d d d d d d d d d d d
n Taekwondo matches where competitors are randomly assigned to wear either a
d d d d d d d d d d d d
red or blue uniform? In a sample of 80 Taekwondo matches, there were 45 matche
d d d d d d d d d d d d d d
s where thered uniform wearer won.
d d d d d d
1. What is the parameter of interest for this study?
d d d d d d d d
A. The long- d
run proportion of Taekwondo matches in which the red uniform wearerwi
d d d d d d d d d d d
ns
B. The proportion of matches in which the red uniform wearer wins in a sampl
d d d d d d d d d d d d d
e of 80Taekwondo matches
d d d d
C. Whether the red uniform wearer wins a match d d d d d d d
D. 0.50 d
Ans: A; LO: 1.1-1; Difficulty: Easy; Type: MC
d d d d d d d
2. What is the statistic for this study?
d d d d d d
A. The long- d
run proportion of Taekwondo matches in which the red uniform wearerwi
d d d d d d d d d d d
ns
B. The proportion of matches in which the red uniform wearer wins in a sampl
d d d d d d d d d d d d d
e of 80Taekwondo matches
d d d d
C. Whether the red uniform wearer wins a match d d d d d d d
D. 0.50 d
Ans: B; LO: 1.1-1; Difficulty: Easy; Type: MC
d d d d d d d
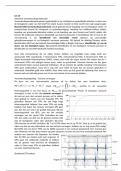
3. Given below is the simulated distribution of the number of ―red wins‖ that could ha
d d d d d d d d d d d d d d
ppen bychance alone in a sample of 80 matches. Based on this simulation, is our o
d d d d d d d d d d d d d d d d
bserved result statistically significant?
d d d
A. Yes, since 45 is larger than 40.
d d d d d d
B. Yes, since the height of the dotplot above 45 is smaller than the height
d d d d d d d d d d d d d d
of thedotplot above 40.
d d d d
FOR INSTRUCTOR USE ONLY d d d
Introduction to Statistical
Investigations,
2nd Edition Nathan Tintle; Beth
L. Chance Chapters 1 - 11,
Complete
FOR INSTRUCTOR USE ONLY
d d d
,TABLE OF CONTENTS
d d d
Chapter 1 – Significance: How Strong is the Evidence
d d d d d d d d d
Chapter 2 –
d d
dGeneralization: How Broadly Do the Results Apply?
d d d d d d d
Chapter 3 – Estimation: How Large is the Effect?
d d d d d d d d d
Chapter 4 –
d d
dCausation: Can We Say What Caused the Effect?
d d d d d d d d
Chapter 5 – Comparing Two Proportions
d d d d d d
Chapter 6 – Comparing Two Means
d d d d d d
Chapter 7 – Paired Data: One Quantitative Variable
d d d d d d d d
Chapter 8 – Comparing More Than Two Proportions
d d d d d d d d
Chapter 9 – Comparing More Than Two Means
d d d d d d d d
Chapter 10 – Two Quantitative Variables
d d d d d d
Chapter 11 – Modeling Randomness
d d d d
FOR INSTRUCTOR USE ONLY
d d d
,Chapter 1 d
Note: TE = Text entry
ddd d d d TE-N = Text entry - d d d d
d NumericMa = Matching d d d MS = Multiple select
d d d
MC = Multiple choice
d d d TF = True-
d d
FalseE = Easy, M = Medium, H = Hard
d d d d d d d d d
CHAPTER 1 LEARNING OBJECTIVES d d d
CLO1-1: Use the chance model to determine whether an observed statistic is unlikely to occur.
d d d d d d d d d d d d d d
CLO1-2: Calculate and interpret a p-
d d d d d
value, and state the strength of evidence it provides againstthe null hypothesis.
d d d d d d d d d d d d
CLO1-
3: Calculate a standardized statistic for a single proportion and evaluate the str
d d d d d d d d d d d d
ength ofevidence it provides against a null hypothesis.
d d d d d d d d
CLO1-
4: Describe how the distance of the observed statistic from the parameter value spe
d d d d d d d d d d d d d
cifiedby the null hypothesis, sample size, and one- vs. two-
d d d d d d d d d d
sided tests affect the strength of evidence against the null hypothesis.
d d d d d d d d d d
CLO1-5: Describe how to carry out a theory-based, one-proportion z-test.
d d d d d d d d d
Section 1.1: Introduction to Chance Models d d d d d
LO1.1-1: Recognize the difference between parameters and statistics.
d d d d d d d
LO1.1-
2: Describe how to use coin tossing to simulate outcomes from a chance model of t
d d d d d d d d d d d d d d d
he ran-dom choice between two events.
d d d d d d
LO1.1-3: Use the One Proportion applet to carry out the coin tossing simulation.
d d d d d d d d d d d d
LO1.1-
4: Identify whether or not study results are statistically significant and whether
d d d d d d d d d d d d
or not thechance model is a plausible explanation for the data.
d d d d d d d d d d d
LO1.1-
5: Implement the 3S strategy: find a statistic, simulate results from a chance mo
d d d d d d d d d d d d d
del, andcomment on strength of evidence against observed study results happen
d d d d d d d d d d d
ing by chance alone.
d d d
LO1.1-
6: Differentiate between saying the chance model is plausible and the chance mode
d d d d d d d d d d d d
l is thecorrect explanation for the observed data.
d d d d d d d d
FOR INSTRUCTOR USE ONLY d d d
, 1-2 Test Bank for Introduction to Statistical Investigations, 2nd Edition
d d d d d d d d
Questions 1 through 4:
d d d
Do red uniform wearers tend to win more often than those wearing blue uniforms i
d d d d d d d d d d d d d d
n Taekwondo matches where competitors are randomly assigned to wear either a
d d d d d d d d d d d d
red or blue uniform? In a sample of 80 Taekwondo matches, there were 45 matche
d d d d d d d d d d d d d d
s where thered uniform wearer won.
d d d d d d
1. What is the parameter of interest for this study?
d d d d d d d d
A. The long- d
run proportion of Taekwondo matches in which the red uniform wearerwi
d d d d d d d d d d d
ns
B. The proportion of matches in which the red uniform wearer wins in a sampl
d d d d d d d d d d d d d
e of 80Taekwondo matches
d d d d
C. Whether the red uniform wearer wins a match d d d d d d d
D. 0.50 d
Ans: A; LO: 1.1-1; Difficulty: Easy; Type: MC
d d d d d d d
2. What is the statistic for this study?
d d d d d d
A. The long- d
run proportion of Taekwondo matches in which the red uniform wearerwi
d d d d d d d d d d d
ns
B. The proportion of matches in which the red uniform wearer wins in a sampl
d d d d d d d d d d d d d
e of 80Taekwondo matches
d d d d
C. Whether the red uniform wearer wins a match d d d d d d d
D. 0.50 d
Ans: B; LO: 1.1-1; Difficulty: Easy; Type: MC
d d d d d d d
3. Given below is the simulated distribution of the number of ―red wins‖ that could ha
d d d d d d d d d d d d d d
ppen bychance alone in a sample of 80 matches. Based on this simulation, is our o
d d d d d d d d d d d d d d d d
bserved result statistically significant?
d d d
A. Yes, since 45 is larger than 40.
d d d d d d
B. Yes, since the height of the dotplot above 45 is smaller than the height
d d d d d d d d d d d d d d
of thedotplot above 40.
d d d d
FOR INSTRUCTOR USE ONLY d d d