Causal analysis techniques (CAT)
Course goals
- To define key concepts which are relevant for using the techniques included in the obligatory
course materials (knowledge)
- To summarize the assumptions of the statistical techniques that are discussed in the course and
evaluate to what extent such assumptions have been fulfilled in a specific empirical application
(knowledge, evaluation).
- To explain how variance in observed scores in a One-Way Between-Subjects ANOVA and an OLS
or logistic regression analysis is dissected in a systematic and error component (comprehension)
- To, using SPSS, independently execute relevant data-manipulations (for examples, construct
dummy variables and interaction terms) and subsequently execute a data-analysis correctly (i.e.,
estimate (partial) correlations, execute a One-Way Between-Subjects ANOVA, execute a
sequential multiple OLS regression with dummy variables or interaction terms, estimate a path
model, and execute a sequential logistic regression analysis (application)
- To correctly interpret the SPSS output of such analyses (interpretation of model coefficients and
tests) and, if necessary, independently compute relevant statistics – for example, a total causal
effect in a path model (application, evaluation).
- To correctly apply the logic of the elaboration model to the results of a partial correlation
analysis or a sequential multiple OLS regression analysis and evaluate the type of association
between variables (evaluation)
The stati sti cal methods of this course
One-Way Between-Subjects Analysis of Variance (ANOVA)
Pearson’s (Partial) Correlation Coefficient
Bivariate Regression
Multiple Regression
Elaboration Logic
Path Analysis
Logistic Regression Analysis
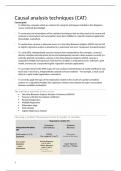
Choosing a method: Measurement level & number of variables
1
,LECTURE 1&2: ANOVA – ONE WAY BETWEEN SUBJECTS ANALYSIS OF VARIANCE
- In which situation ANOVA is applicable / When to use ANOVA
- What hypotheses can be tested with ANOVA
- The key logic behind ANOVA
- How to calculate the deviations from the mean(s)
LOGIC OF ANOVA
Hypothesis: A person’s degree of organizational commitment (Y) depends on the team in which the
person works (X)
When to use ANOVA?
The dependent variable We want to explain some of organization commitment (Y)
The independent variable The team in which someone works in (X)
*Team is categorical: you cannot necessarily put them in an order, and we assume there are more
than 2 teams.
When in every team the commitment would be the same the average would be the same and it
doesn’t matter in which team you are.
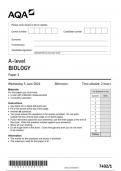
Example from the hypothesis:
Is there a difference? Yes, we see a difference in
variance. We want to know this because it is
important to know if there is a difference in
means.
The average is the same in both scenarios.
Between the teams, there is a difference in
average.
Variance = a measure of variability
Better view from a visualization that there is significant
difference:
Key idea of ANOVA
ANOVA: ‘When there are 2 or more groups, can we make a statement about possible -significant-
differences between the mean scores of the groups?’
Intermezzo: ‘What could we do if there were only 2 groups? T-test
ANOVA is the same as t-test but for many groups.
2
,Between and within groups
Between-group variance = about the group means
Within-group variance = all other variables that influences Y
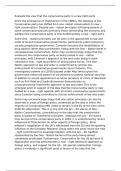
Example:
The between-group variance is the same because the average is the same (left)
The within-group variance is different (right)
Important to realize:
Any differences within a group cannot be due to differences between the groups because
everyone in a particular group has the same group score; so, within-group differences must be
due to systematic unmeasured factors (e.g., individual differences) or random measurement
error
Any observed differences between groups are probably not only pure between-group
differences, but also differences due to systematic unmeasured factors or random measurement
error
Statistical null hypothesis of ANOVA:
Mean scores of k populations corresponding to the groups in the study are all equal to each other:
H0 = 1 = 2 = … = k
Reject H0 when at least one mean is significantly different from the other means.
3
, CALCULATIONS
F-statistic / F-distribution: In order to determine if a specific sample result is exceptional
(‘significant’) under the assumption that the statistical null hypothesis is correct, the test-statistic F
has to be calculated.
Strategy: Partition of scores into components
Component of score that is associated with ‘group’
Component of score that is not associated with ‘group’
Calculate the deviations scores:
1. Deviation of individual score from grand mean: Yij – My
2. Deviation of individual score from group mean: (Y ij – Mi) = ij
3. Deviation of group mean from grand mean: (Mi – My) α i
αi denotes the ‘effect of group i’
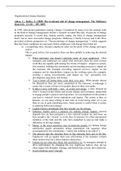
Example:
Calculating the grand mean
Calculating the differences within the
group and the group mean (within-
group)
Calculating the differences between
the group mean and the grand mean
But…
4
Course goals
- To define key concepts which are relevant for using the techniques included in the obligatory
course materials (knowledge)
- To summarize the assumptions of the statistical techniques that are discussed in the course and
evaluate to what extent such assumptions have been fulfilled in a specific empirical application
(knowledge, evaluation).
- To explain how variance in observed scores in a One-Way Between-Subjects ANOVA and an OLS
or logistic regression analysis is dissected in a systematic and error component (comprehension)
- To, using SPSS, independently execute relevant data-manipulations (for examples, construct
dummy variables and interaction terms) and subsequently execute a data-analysis correctly (i.e.,
estimate (partial) correlations, execute a One-Way Between-Subjects ANOVA, execute a
sequential multiple OLS regression with dummy variables or interaction terms, estimate a path
model, and execute a sequential logistic regression analysis (application)
- To correctly interpret the SPSS output of such analyses (interpretation of model coefficients and
tests) and, if necessary, independently compute relevant statistics – for example, a total causal
effect in a path model (application, evaluation).
- To correctly apply the logic of the elaboration model to the results of a partial correlation
analysis or a sequential multiple OLS regression analysis and evaluate the type of association
between variables (evaluation)
The stati sti cal methods of this course
One-Way Between-Subjects Analysis of Variance (ANOVA)
Pearson’s (Partial) Correlation Coefficient
Bivariate Regression
Multiple Regression
Elaboration Logic
Path Analysis
Logistic Regression Analysis
Choosing a method: Measurement level & number of variables
1
,LECTURE 1&2: ANOVA – ONE WAY BETWEEN SUBJECTS ANALYSIS OF VARIANCE
- In which situation ANOVA is applicable / When to use ANOVA
- What hypotheses can be tested with ANOVA
- The key logic behind ANOVA
- How to calculate the deviations from the mean(s)
LOGIC OF ANOVA
Hypothesis: A person’s degree of organizational commitment (Y) depends on the team in which the
person works (X)
When to use ANOVA?
The dependent variable We want to explain some of organization commitment (Y)
The independent variable The team in which someone works in (X)
*Team is categorical: you cannot necessarily put them in an order, and we assume there are more
than 2 teams.
When in every team the commitment would be the same the average would be the same and it
doesn’t matter in which team you are.
Example from the hypothesis:
Is there a difference? Yes, we see a difference in
variance. We want to know this because it is
important to know if there is a difference in
means.
The average is the same in both scenarios.
Between the teams, there is a difference in
average.
Variance = a measure of variability
Better view from a visualization that there is significant
difference:
Key idea of ANOVA
ANOVA: ‘When there are 2 or more groups, can we make a statement about possible -significant-
differences between the mean scores of the groups?’
Intermezzo: ‘What could we do if there were only 2 groups? T-test
ANOVA is the same as t-test but for many groups.
2
,Between and within groups
Between-group variance = about the group means
Within-group variance = all other variables that influences Y
Example:
The between-group variance is the same because the average is the same (left)
The within-group variance is different (right)
Important to realize:
Any differences within a group cannot be due to differences between the groups because
everyone in a particular group has the same group score; so, within-group differences must be
due to systematic unmeasured factors (e.g., individual differences) or random measurement
error
Any observed differences between groups are probably not only pure between-group
differences, but also differences due to systematic unmeasured factors or random measurement
error
Statistical null hypothesis of ANOVA:
Mean scores of k populations corresponding to the groups in the study are all equal to each other:
H0 = 1 = 2 = … = k
Reject H0 when at least one mean is significantly different from the other means.
3
, CALCULATIONS
F-statistic / F-distribution: In order to determine if a specific sample result is exceptional
(‘significant’) under the assumption that the statistical null hypothesis is correct, the test-statistic F
has to be calculated.
Strategy: Partition of scores into components
Component of score that is associated with ‘group’
Component of score that is not associated with ‘group’
Calculate the deviations scores:
1. Deviation of individual score from grand mean: Yij – My
2. Deviation of individual score from group mean: (Y ij – Mi) = ij
3. Deviation of group mean from grand mean: (Mi – My) α i
αi denotes the ‘effect of group i’
Example:
Calculating the grand mean
Calculating the differences within the
group and the group mean (within-
group)
Calculating the differences between
the group mean and the grand mean
But…
4