Samenvatting
Summary "Linear Regression and HPLC Analysis in Pharmaceutical Research"
Beoordeling
Verkocht
-
Pagina's
2
Geüpload op
13-02-2025
Geschreven in
2024/2025
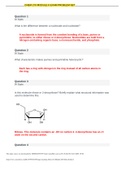
1. Image: The image contains an R script for performing a linear regression analysis using the ggplot2 and reshape2 libraries. The script creates a dataset with drug concentration and peak area, fits a linear regression model, and visualizes the relationship using a scatter plot with a regression line. Additionally, there is a mention of a hand-drawn plot related to pharmaceutical analysis using HPLC (High-Performance Liquid Chromatography). 2. File: I haven't opened the uploaded file yet. Let me know if you want me to read or analyze its contents.
Meer zien
Lees minder
Instelling
Vak
Oeps! We kunnen je document nu niet laden. Probeer het nog eens of neem contact op met support.

Geschreven voor
- Instelling
- Middelbare school
- Computer
- School jaar
- 4
Alle documenten voor dit vak (260)
Documentinformatie
- Geüpload op
- 13 februari 2025
- Aantal pagina's
- 2
- Geschreven in
- 2024/2025
- Type
- Samenvatting
Onderwerpen
-
introduction to python
-
variables and datatypes
-
functions in python
€4,19
Krijg toegang tot het volledige document:
100% tevredenheidsgarantie
Direct beschikbaar na je betaling
Lees online óf als PDF
Geen vaste maandelijkse kosten
Maak kennis met de verkoper
ahalsparkle