Probability
outline is on the side
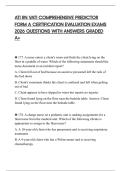
Skewness and Kurtosis
➔two more descriptive stats, associated w/ spread
➔skewness:how symmetrical the observations are aroundthe mean
◆ important because it influences the measures of central tendency and probabilistic
distributions
◆ positive distribution/ left-skewed:the peak is towardsthe left and the tail is along the
right end of the curve
● extreme values are closer to the mean, meaning the mean is greater than the
median
● the mean is the better measure when looking at a positive distribution
◆ negative distribution/ right-skewed:the peak is towardsthe right and the tail is along the
left end of the curve
● extreme values are by the peak, meaning the mean is less that the median
● the median is the better measure ,when looking at a negative distribution
➔kurtosis:how clustered or flat the observations are
◆ mesokurtic:kurtosis of 0
● normal distribution
◆ leptokurtic:positive kurtosis
● skinner than usual
◆ platykurtic:negative kurtosis
● flatter than usual (think platypus w/ a flat beak)
◆ does not affect measures of central tendency
Probability Theory
➔provides description of hidden structure that exists within an infinite/large population of
observations/outcomes
◆ look at the structure within the chaos
➔way of defining boundaries between results of mere chance vs results not by mere chance
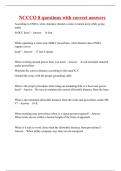
➔two approaches to probability
◆ rational
◆ empirical
, Approach Source Priority Starting Point
Rational (A priori) k nowledge based on r eason > experience; e xpected outcomes
reason/logic, not raises reasoning and (educated guess w/ all
experience logic to mathematical all information);
precision expected % are
determined before the
occurrence of an
outcome
Empirical (A k nowledge is based on experience > reason bserved outcome
o
posteriori) experience/observati (deduce based on
onrather than reason gathered info through
alone experience); expected
% determined on
experience; additional
observations could
lead to updating
current expectations
Basic Definitions
➔event/outcome:the occurrence of something that isobserved
➔probability:the likelihood of an event happening
◆ expressed in proportions (0-1) or percentages (0-100%)
◆ P(event) = number of event outcomes/total number of outcomes
➔complement rule:P(A) + P’(A) = 1OR100%
➔exampleofA priori/rational approach
◆ using a 6-sided die, what is the probability of rolling a 6?
● (possible outcomes: 1,2,3,4,5, and 6)
◆ P(6) = number of 6s on a die / total number of numbers on a die
● P(6) = 1 /6
● 0.1666667
➔exampleofA posteriori/empirical approach
◆ you have a bag of marbles. you don’t know how many red and black marbles are inside.
◆ Pick 1: you pick out a marble at random, it’s red. observed relative frequency between
red and black marbles?
● red = 100% and black = 0%
○ you haven’t witness a black marble from the bag yet to have any reason for
believing a black marble exists in the bag
outline is on the side
Skewness and Kurtosis
➔two more descriptive stats, associated w/ spread
➔skewness:how symmetrical the observations are aroundthe mean
◆ important because it influences the measures of central tendency and probabilistic
distributions
◆ positive distribution/ left-skewed:the peak is towardsthe left and the tail is along the
right end of the curve
● extreme values are closer to the mean, meaning the mean is greater than the
median
● the mean is the better measure when looking at a positive distribution
◆ negative distribution/ right-skewed:the peak is towardsthe right and the tail is along the
left end of the curve
● extreme values are by the peak, meaning the mean is less that the median
● the median is the better measure ,when looking at a negative distribution
➔kurtosis:how clustered or flat the observations are
◆ mesokurtic:kurtosis of 0
● normal distribution
◆ leptokurtic:positive kurtosis
● skinner than usual
◆ platykurtic:negative kurtosis
● flatter than usual (think platypus w/ a flat beak)
◆ does not affect measures of central tendency
Probability Theory
➔provides description of hidden structure that exists within an infinite/large population of
observations/outcomes
◆ look at the structure within the chaos
➔way of defining boundaries between results of mere chance vs results not by mere chance
➔two approaches to probability
◆ rational
◆ empirical
, Approach Source Priority Starting Point
Rational (A priori) k nowledge based on r eason > experience; e xpected outcomes
reason/logic, not raises reasoning and (educated guess w/ all
experience logic to mathematical all information);
precision expected % are
determined before the
occurrence of an
outcome
Empirical (A k nowledge is based on experience > reason bserved outcome
o
posteriori) experience/observati (deduce based on
onrather than reason gathered info through
alone experience); expected
% determined on
experience; additional
observations could
lead to updating
current expectations
Basic Definitions
➔event/outcome:the occurrence of something that isobserved
➔probability:the likelihood of an event happening
◆ expressed in proportions (0-1) or percentages (0-100%)
◆ P(event) = number of event outcomes/total number of outcomes
➔complement rule:P(A) + P’(A) = 1OR100%
➔exampleofA priori/rational approach
◆ using a 6-sided die, what is the probability of rolling a 6?
● (possible outcomes: 1,2,3,4,5, and 6)
◆ P(6) = number of 6s on a die / total number of numbers on a die
● P(6) = 1 /6
● 0.1666667
➔exampleofA posteriori/empirical approach
◆ you have a bag of marbles. you don’t know how many red and black marbles are inside.
◆ Pick 1: you pick out a marble at random, it’s red. observed relative frequency between
red and black marbles?
● red = 100% and black = 0%
○ you haven’t witness a black marble from the bag yet to have any reason for
believing a black marble exists in the bag