13 | Inventory Management and Planning and
Control Systems
Inventory is created to compensate for the differences in timing between supply and demand
Reasons to avoid inventories
Physical Queues Information in databases
Cost High insurance or Wastes customers Cost of updates and
administrative costs time maintenance
space Requires storage Requires waiting Requires memory capacity
areas
Quality May deteriorate over May upset Data may become corrupted or
time customers obsolete
Operational/ May hide problems May put undue Data needs constant updating/
organizational pressure on staff securing
How can physical inventory be reduced?
Reason for holding inventory How to reduce inventory
Counteract a lack of flexibility Tighten supply
Maintain flexibility when other products are Increase flexibility of processes
being made Use parallel processes producing
outputs simultaneously
Insurance against uncertainty • Improve demand forecasting
Take advantage of relatively short term • Persuade supplier to adopt everyday
opportunities low prices
suppliers offer limited time low cost offers
Anticipate future demands • Increase volume flexibility → chase
Build stock in low demand (level plan) demand plan
Reduce overall costs • Reduce admin costs through
Purchasing a batch to save costs purchasing process
• Efficiency gains
• Investigate alternative delivery channel
to reduce transport cost
Fill the processing pipeline • Reduce processing time (PT) between
request and dispatch
• Reduce Throughput time (TH) in
downstream supply chain
Effect on returns on assets
Ability to supply from stock Storage and ordering costs
profit revenue−costs
return on assets= =
total assets working capital+ ¿ assets
Amount you owe to suppliers and customers
owe to you + cost of funding inventory
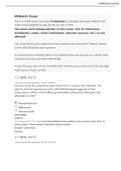
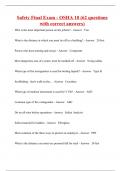
, When to order (timing decision)
Inventory level
ROL(reorder level )=order lead time× demand rate
Slope = demand rate
Average inventory =
ROL Q
2
time
ROP Deliveries at a rate of
Q 𝐷
per period
𝑄
D
Deliveries at a rate of
Order lead time
How much to order (volume decision)
Determine the economic order quantity (EOQ) Q* such that the total costs per year are minimal
• Total costs = total order costs + total holding costs
D
• Total order costs are Co (order per year × order cost per order)
Q
Q
• Total holding costs are Ch (average number of stock × holding costs)
2
DCo Q Ch
• Total costs per year for Q is Ct(Q) = +
Q 2
• Solution: find the minimum by equating derivative to zero C t’(Q) = 0
which gives EOQ = Q* ¿
√ 2 CoD
Ch
! EOQ and timing decision together are a complete policy!
What happens when we can only order batches?
If it is in the middle take the higher one
When it is not in the middle compute total cost of both to decide which one has the lowest
total cost -> do this with every value that is not a integer
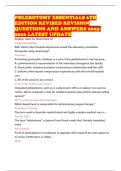
, What happens when we produce our own inventory?
Order
quantity
Slope = P-D
slope = De-
mand
M=
maximum
level of
inventory
Q
P
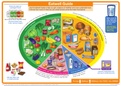
lead time usage distribution
combine order lead time normal distribution with the demand rate normal distribution
make an table with the probabilities and lead time and demand rate
LTD = lead time demand
Average demand
Slow demand High demand
a = Out of stock
probability
µLTD (expected LTD) Safety stock ROL - µLTD
Thus, P ¿
Let Z 1−α =ϕ−1 (1−α ), which can be retrieved from the Z-table
So that, ROL=µLTD +σLTD × Z 1−α , and safety stock is s=ROL−µLTD=σLTD × Z 1−a
Calculate of ROL step-by-step
1. Determine EOQ
stockouts
2. Determine a, how many stockouts per year are acceptable ->
order per year
3. Determine µLTD and σ 2 LTD
4. demand during order lead time = µLTD with a standard deviation of σLTD
5. now determine the level of ROL such that
P ( stockout )=α ,∨P ( LTD> ROL ) =α ,∨P ( LTD ≤ ROL )=1−α
6. find Z1-a
ROL−µ
7. =Z 1−a fill in the formula to find ROL
σ
Control Systems
Inventory is created to compensate for the differences in timing between supply and demand
Reasons to avoid inventories
Physical Queues Information in databases
Cost High insurance or Wastes customers Cost of updates and
administrative costs time maintenance
space Requires storage Requires waiting Requires memory capacity
areas
Quality May deteriorate over May upset Data may become corrupted or
time customers obsolete
Operational/ May hide problems May put undue Data needs constant updating/
organizational pressure on staff securing
How can physical inventory be reduced?
Reason for holding inventory How to reduce inventory
Counteract a lack of flexibility Tighten supply
Maintain flexibility when other products are Increase flexibility of processes
being made Use parallel processes producing
outputs simultaneously
Insurance against uncertainty • Improve demand forecasting
Take advantage of relatively short term • Persuade supplier to adopt everyday
opportunities low prices
suppliers offer limited time low cost offers
Anticipate future demands • Increase volume flexibility → chase
Build stock in low demand (level plan) demand plan
Reduce overall costs • Reduce admin costs through
Purchasing a batch to save costs purchasing process
• Efficiency gains
• Investigate alternative delivery channel
to reduce transport cost
Fill the processing pipeline • Reduce processing time (PT) between
request and dispatch
• Reduce Throughput time (TH) in
downstream supply chain
Effect on returns on assets
Ability to supply from stock Storage and ordering costs
profit revenue−costs
return on assets= =
total assets working capital+ ¿ assets
Amount you owe to suppliers and customers
owe to you + cost of funding inventory
, When to order (timing decision)
Inventory level
ROL(reorder level )=order lead time× demand rate
Slope = demand rate
Average inventory =
ROL Q
2
time
ROP Deliveries at a rate of
Q 𝐷
per period
𝑄
D
Deliveries at a rate of
Order lead time
How much to order (volume decision)
Determine the economic order quantity (EOQ) Q* such that the total costs per year are minimal
• Total costs = total order costs + total holding costs
D
• Total order costs are Co (order per year × order cost per order)
Q
Q
• Total holding costs are Ch (average number of stock × holding costs)
2
DCo Q Ch
• Total costs per year for Q is Ct(Q) = +
Q 2
• Solution: find the minimum by equating derivative to zero C t’(Q) = 0
which gives EOQ = Q* ¿
√ 2 CoD
Ch
! EOQ and timing decision together are a complete policy!
What happens when we can only order batches?
If it is in the middle take the higher one
When it is not in the middle compute total cost of both to decide which one has the lowest
total cost -> do this with every value that is not a integer
, What happens when we produce our own inventory?
Order
quantity
Slope = P-D
slope = De-
mand
M=
maximum
level of
inventory
Q
P
lead time usage distribution
combine order lead time normal distribution with the demand rate normal distribution
make an table with the probabilities and lead time and demand rate
LTD = lead time demand
Average demand
Slow demand High demand
a = Out of stock
probability
µLTD (expected LTD) Safety stock ROL - µLTD
Thus, P ¿
Let Z 1−α =ϕ−1 (1−α ), which can be retrieved from the Z-table
So that, ROL=µLTD +σLTD × Z 1−α , and safety stock is s=ROL−µLTD=σLTD × Z 1−a
Calculate of ROL step-by-step
1. Determine EOQ
stockouts
2. Determine a, how many stockouts per year are acceptable ->
order per year
3. Determine µLTD and σ 2 LTD
4. demand during order lead time = µLTD with a standard deviation of σLTD
5. now determine the level of ROL such that
P ( stockout )=α ,∨P ( LTD> ROL ) =α ,∨P ( LTD ≤ ROL )=1−α
6. find Z1-a
ROL−µ
7. =Z 1−a fill in the formula to find ROL
σ