WGU C955 - Module 6: Correlation & i.- i.- i.- i.- i.- i.- i.-
Regression Quiz with Verified Answers. i.- i.- i.- i.- i.-
Consider the following equation, y+8x=−2 . What is the y -intercept of a
i.- i.- i.- i.- i.- i.- i.- i.- i.- i.- i.- i.- i.-
line with this equation?
i.- i.- i.-
a −2
i.- i.-
b2i.- i.-
c8
i.- i.-
d −8
i.- i.-i.- i.- -2
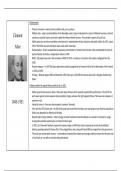
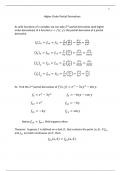
Using the scatterplot below, what type of correlation is suggested?
i.- i.- i.- i.- i.- i.- i.- i.- i.- i.-
Scatterplot displaying data points distributed from lower left to upper
i.- i.- i.- i.- i.- i.- i.- i.- i.- i.-
right. Points are relatively close to one another.
i.- i.- i.- i.- i.- i.- i.-
a No correlation
i.- i.-
b Weak negative positive
i.- i.- i.-
c Moderate positive
i.- i.-
d Strong negative
i.- i.- i.-i.- i.- Moderate positive i.-
When constructing a line of best fit, what must be minimized?
i.- i.- i.- i.- i.- i.- i.- i.- i.- i.-
a The vertical distances between that line and the data points.
i.- i.- i.- i.- i.- i.- i.- i.- i.- i.-
,b The length of the line.
i.- i.- i.- i.- i.-
c The correlation coefficient.
i.- i.- i.-
d The p-value
i.- i.- i.-i.- i.- The vertical distances between that line and the
i.- i.- i.- i.- i.- i.- i.- i.-
data points. i.-
Which correlation coefficient suggests the strongest correlation?
i.- i.- i.- i.- i.- i.-
a −0.9
i.- i.-
b −0.3
i.- i.-
c 0.1
i.- i.-
d 0.8
i.- i.-i.- i.- -0.9
The following table shows the performance of two airlines in two
i.- i.- i.- i.- i.- i.- i.- i.- i.- i.- i.-
different cities. Is there a Simpson's Paradox occurring?
i.- i.- i.- i.- i.- i.- i.-
Airline A Delayed Flights Airline A % Delayed Airline B Delayed Flights
i.- i.- i.- i.- i.- i.- i.- i.- i.- i.- i.- i.-
Airline B % Delayed Total Delayed Total % Delayed
i.- i.- i.- i.- i.- i.- i.- i.-
Los Angeles 62/559 11.10% 460/3450 13.30% 522/4009 13%
i.- i.- i.- i.- i.- i.- i.- i.-
San Diego 46/396 11.60% 30/221 13.60% 76/617 12.30%
i.- i.- i.- i.- i.- i.- i.- i.-
a No, because an equal number of flights departed from each city.
i.- i.- i.- i.- i.- i.- i.- i.- i.- i.- i.-
b No, because it's clear from the data that Los Angeles has a higher rate
i.- i.- i.- i.- i.- i.- i.- i.- i.- i.- i.- i.- i.- i.- i.-
of delayed flights.
i.- i.-
c Yes, because the delayed flight rates were different for each city.
i.- i.- i.- i.- i.- i.- i.- i.- i.- i.- i.-
, d Yes, because while Los Angeles has a greater overal rate of delayed
i.- i.- i.- i.- i.- i.- i.- i.- i.- i.- i.- i.- i.-
flights, San Diego has a greater rate of delayed flights when looking at
i.- i.- i.- i.- i.- i.- i.- i.- i.- i.- i.- i.- i.-
the individual airlines.
i.- Yes, because while Los Angeles has a i.- i.-i.- i.- i.- i.- i.- i.- i.- i.- i.-
greater overal rate of delayed flights, San Diego has a greater rate of
i.- i.- i.- i.- i.- i.- i.- i.- i.- i.- i.- i.- i.-
delayed flights when looking at the individual airlines.
i.- i.- i.- i.- i.- i.- i.-
A restaurant owner wants to see if she can use low temperatures to
i.- i.- i.- i.- i.- i.- i.- i.- i.- i.- i.- i.- i.-
boost soup sales at her restaurant. To study a possible relationship
i.- i.- i.- i.- i.- i.- i.- i.- i.- i.- i.-
between temperature and soup sales, she collects data throughout the
i.- i.- i.- i.- i.- i.- i.- i.- i.- i.-
year on the temperature of a given day (ranging between 20 degrees F
i.- i.- i.- i.- i.- i.- i.- i.- i.- i.- i.- i.- i.-
and 90 degrees F) and the amount of soup sold that day. She performs
i.- i.- i.- i.- i.- i.- i.- i.- i.- i.- i.- i.- i.- i.-
a linear regression and comes up with a least squares regression line of
i.- i.- i.- i.- i.- i.- i.- i.- i.- i.- i.- i.- i.-
y=−1.64x+176.6 with r=−0.89 where x is the temperature (in degrees F) i.- i.- i.- i.- i.- i.- i.- i.- i.- i.- i.-
and y is the number of daily soup sales. What is the correct
i.- i.- i.- i.- i.- i.- i.- i.- i.- i.- i.- i.- i.-
interpretation of the slope of the regression line? i.- i.- i.- i.- i.- i.- i.-
a For every increase in one degree Fahrenheit, there is a corresponding
i.- i.- i.- i.- i.- i.- i.- i.- i.- i.- i.- i.-
increase of 1.64 sales of soup. i.- i.- i.- i.- i.-
b For every increase of one degree Fahrenheit, there is a corresponding
i.- i.- i.- i.- i.- i.- i.- i.- i.- i.- i.- i.-
increase of 176.6 sales of soup. i.- i.- i.- i.- i.-
c For every increase in one degree Fahrenheit, there is a corresponding
i.- i.- i.- i.- i.- i.- i.- i.- i.- i.- i.- i.-
decrease of 1.64 sales of soup. i.- i.- i.- i.- i.-
d For every incre
i.- For every increase in one degree Fahrenheit,
i.- i.- i.-i.- i.- i.- i.- i.- i.- i.- i.- i.-
there is a corresponding decrease of 1.64 sales of soup.
i.- i.- i.- i.- i.- i.- i.- i.- i.-
A researcher wants to know if there was a relationship between
i.- i.- i.- i.- i.- i.- i.- i.- i.- i.- i.-
student age and desire to complete a college degree. To answer this
i.- i.- i.- i.- i.- i.- i.- i.- i.- i.- i.- i.-
Regression Quiz with Verified Answers. i.- i.- i.- i.- i.-
Consider the following equation, y+8x=−2 . What is the y -intercept of a
i.- i.- i.- i.- i.- i.- i.- i.- i.- i.- i.- i.- i.-
line with this equation?
i.- i.- i.-
a −2
i.- i.-
b2i.- i.-
c8
i.- i.-
d −8
i.- i.-i.- i.- -2
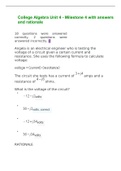
Using the scatterplot below, what type of correlation is suggested?
i.- i.- i.- i.- i.- i.- i.- i.- i.- i.-
Scatterplot displaying data points distributed from lower left to upper
i.- i.- i.- i.- i.- i.- i.- i.- i.- i.-
right. Points are relatively close to one another.
i.- i.- i.- i.- i.- i.- i.-
a No correlation
i.- i.-
b Weak negative positive
i.- i.- i.-
c Moderate positive
i.- i.-
d Strong negative
i.- i.- i.-i.- i.- Moderate positive i.-
When constructing a line of best fit, what must be minimized?
i.- i.- i.- i.- i.- i.- i.- i.- i.- i.-
a The vertical distances between that line and the data points.
i.- i.- i.- i.- i.- i.- i.- i.- i.- i.-
,b The length of the line.
i.- i.- i.- i.- i.-
c The correlation coefficient.
i.- i.- i.-
d The p-value
i.- i.- i.-i.- i.- The vertical distances between that line and the
i.- i.- i.- i.- i.- i.- i.- i.-
data points. i.-
Which correlation coefficient suggests the strongest correlation?
i.- i.- i.- i.- i.- i.-
a −0.9
i.- i.-
b −0.3
i.- i.-
c 0.1
i.- i.-
d 0.8
i.- i.-i.- i.- -0.9
The following table shows the performance of two airlines in two
i.- i.- i.- i.- i.- i.- i.- i.- i.- i.- i.-
different cities. Is there a Simpson's Paradox occurring?
i.- i.- i.- i.- i.- i.- i.-
Airline A Delayed Flights Airline A % Delayed Airline B Delayed Flights
i.- i.- i.- i.- i.- i.- i.- i.- i.- i.- i.- i.-
Airline B % Delayed Total Delayed Total % Delayed
i.- i.- i.- i.- i.- i.- i.- i.-
Los Angeles 62/559 11.10% 460/3450 13.30% 522/4009 13%
i.- i.- i.- i.- i.- i.- i.- i.-
San Diego 46/396 11.60% 30/221 13.60% 76/617 12.30%
i.- i.- i.- i.- i.- i.- i.- i.-
a No, because an equal number of flights departed from each city.
i.- i.- i.- i.- i.- i.- i.- i.- i.- i.- i.-
b No, because it's clear from the data that Los Angeles has a higher rate
i.- i.- i.- i.- i.- i.- i.- i.- i.- i.- i.- i.- i.- i.- i.-
of delayed flights.
i.- i.-
c Yes, because the delayed flight rates were different for each city.
i.- i.- i.- i.- i.- i.- i.- i.- i.- i.- i.-
, d Yes, because while Los Angeles has a greater overal rate of delayed
i.- i.- i.- i.- i.- i.- i.- i.- i.- i.- i.- i.- i.-
flights, San Diego has a greater rate of delayed flights when looking at
i.- i.- i.- i.- i.- i.- i.- i.- i.- i.- i.- i.- i.-
the individual airlines.
i.- Yes, because while Los Angeles has a i.- i.-i.- i.- i.- i.- i.- i.- i.- i.- i.-
greater overal rate of delayed flights, San Diego has a greater rate of
i.- i.- i.- i.- i.- i.- i.- i.- i.- i.- i.- i.- i.-
delayed flights when looking at the individual airlines.
i.- i.- i.- i.- i.- i.- i.-
A restaurant owner wants to see if she can use low temperatures to
i.- i.- i.- i.- i.- i.- i.- i.- i.- i.- i.- i.- i.-
boost soup sales at her restaurant. To study a possible relationship
i.- i.- i.- i.- i.- i.- i.- i.- i.- i.- i.-
between temperature and soup sales, she collects data throughout the
i.- i.- i.- i.- i.- i.- i.- i.- i.- i.-
year on the temperature of a given day (ranging between 20 degrees F
i.- i.- i.- i.- i.- i.- i.- i.- i.- i.- i.- i.- i.-
and 90 degrees F) and the amount of soup sold that day. She performs
i.- i.- i.- i.- i.- i.- i.- i.- i.- i.- i.- i.- i.- i.-
a linear regression and comes up with a least squares regression line of
i.- i.- i.- i.- i.- i.- i.- i.- i.- i.- i.- i.- i.-
y=−1.64x+176.6 with r=−0.89 where x is the temperature (in degrees F) i.- i.- i.- i.- i.- i.- i.- i.- i.- i.- i.-
and y is the number of daily soup sales. What is the correct
i.- i.- i.- i.- i.- i.- i.- i.- i.- i.- i.- i.- i.-
interpretation of the slope of the regression line? i.- i.- i.- i.- i.- i.- i.-
a For every increase in one degree Fahrenheit, there is a corresponding
i.- i.- i.- i.- i.- i.- i.- i.- i.- i.- i.- i.-
increase of 1.64 sales of soup. i.- i.- i.- i.- i.-
b For every increase of one degree Fahrenheit, there is a corresponding
i.- i.- i.- i.- i.- i.- i.- i.- i.- i.- i.- i.-
increase of 176.6 sales of soup. i.- i.- i.- i.- i.-
c For every increase in one degree Fahrenheit, there is a corresponding
i.- i.- i.- i.- i.- i.- i.- i.- i.- i.- i.- i.-
decrease of 1.64 sales of soup. i.- i.- i.- i.- i.-
d For every incre
i.- For every increase in one degree Fahrenheit,
i.- i.- i.-i.- i.- i.- i.- i.- i.- i.- i.- i.-
there is a corresponding decrease of 1.64 sales of soup.
i.- i.- i.- i.- i.- i.- i.- i.- i.-
A researcher wants to know if there was a relationship between
i.- i.- i.- i.- i.- i.- i.- i.- i.- i.- i.-
student age and desire to complete a college degree. To answer this
i.- i.- i.- i.- i.- i.- i.- i.- i.- i.- i.- i.-