GEO4-4408: REMOTE SENSING
Lecture 1: Basics of Remote Sensing
Uses electromagnetic spectrum.
We do not look at the small
wavelengths as they do not work
from a satellite. VIS, NIR, TIR are
used.
Aerial Photo Interpretation
1. Association
2. Pattern
3. Shadow
4. Shape
5. Size
6. Texture
7. Tone
8. Spectral/colour
Colour production: red, green and blue colours can be displayed.
All colours = white, no colours/brightness = black. You can combine
3 different bands in one image (so also others than visual). Often
transform (stretch) information to use colour space effectively. Take
this into account because sometimes the standard stretch gives a
distorted view. For example a cloud is very bright and the rest of
the objects are then dull.
Source: sun
Sensor itself determines what the
image is going to look like, so the
characteristics are important.
We do not use much of the E part.
Interpretation is important by
understanding the other parts.
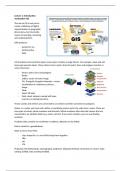
There are a lot of different sensors. Airborne or spaceborne. The spectral bands, spatial resolution,
field of view, orbit (geostationary and polar) and systems (active or passive) are important.
- Spatial resolution: pixel size: chooses the smallest
object you can see
- Frequency vs pixel size is important
- Netherlands: satellietdataportaal.nl
- ESA: european
,Data products are often available with standard processing: geometric correction, sensor calibration
(toa radiance), calibrate for incoming light (toa reflectance), atmospheric and terrain correction (toa
surface reflectance) and quality flags (water, snow, haze labels).
Radiometric calibration: when there are whole numbers, they are often not calibrated. The first step
is to correct for the sensor sensitivity. This gives you raw numbers which you can transform into
radiance, and then the radiance into reflectance. Reflectance is between 0-1 and is the amount of
incoming light which is reflected.
Ways of viewing an images:
- Histogram: which part of the image has lots of information: shows peaks
- Feature space: bright (clouds) and dark (sea)
- Image space
- Spectral signature
We use all of this for interpretation and analysis
- Classification
- NDVI
You can use it for example: wild fires, storms (damage assessment), biomass production, water
quality, deforestation and change detection (glaciers)
,Lecture 2: Imaging Spectroscopy
Satellites, airplanes, drones and ships
Imaging spectrometry: works with hundreds of spectral bands in the soparticle spectrum (0.4 - 2.5
μm). Each pixel has an associated, continuous spectrum that can be used to identify surface
materials. There are absorption features: chemicals present at that specific place at the earth's
surface. We need narrow spectral bands and have a lot of information. We have image cubes:
spectral information in a vertical way. It gives a full spectrum and relates to chemical constituents at
the earth’s surface. Absorption features.
Vegetation reflects a lot of NIR and water absorbs a lot.
Imaging spectrometers acquire images in a
large number (over 40 and up to 400),
narrow (0.01 to 0.02 um), contiguous (i.e.
adjacent) spectral bands to enable the
extraction of reflectance spectra (spectral
signatures) at a pixel scale that can be
directly compared with similar spectra
measured in the field or laboratory.
- Spectrometry: measuring
- Spectroscopy: ‘seeing’, ‘sensing’
- Hyperspectral: (too) many bands
Optical: 0.40-2.5 um (400-2500nm).
Thermal: 3.0-14 um.
Aim:
- A more quantitative approach: absorption bands, full spectral shape
- Intersect: we measure upwelling radiance, emissivity, radiant temperature and reflectance ->
translate into information
Applications: Vegetation & crop properties, soils, minerals, geology, atmosphere, water parameters,
snow and ice hydrology, mining, human infrastructure, etc.
, When plants are diminished. Plant stops photosynthesis, the absorption of NIR disappears, and then
the water content diminishes, so the water absorption bands also disappear.
Why are there absorption features in the spectra of the Earth's surface and the atmosphere?
- Electronic transition of electrons in atoms: electrons go higher orbit and that energy that is
needed coincide with bands in the spectrum.
- Vibrational transition of atom/molecules: absorbs the specific amount of energy with a
specific band: stretching, asymmetric stretching and bending.
o Stretching modes; symmetrical, anti-symmetrical, scissoring, rocking, wagging and
twisting. This can relate to absorption bands of hydrogen etc.
We have overtones of absorption bands. Absorption bands for water Overtones in solar-EM: Major:
1.4-1.9 µm Minor: 0.9-1.1 µm.
Minerals:
- Kaolonite has a very specific dip (2200 nm)
- Hematitie: abosprtion around 900 nm
- Calcite around 2300 nm
With spectrometry image you can asses vegetation health (take into the field to see what happens to
the crop).
Lecture 1: Basics of Remote Sensing
Uses electromagnetic spectrum.
We do not look at the small
wavelengths as they do not work
from a satellite. VIS, NIR, TIR are
used.
Aerial Photo Interpretation
1. Association
2. Pattern
3. Shadow
4. Shape
5. Size
6. Texture
7. Tone
8. Spectral/colour
Colour production: red, green and blue colours can be displayed.
All colours = white, no colours/brightness = black. You can combine
3 different bands in one image (so also others than visual). Often
transform (stretch) information to use colour space effectively. Take
this into account because sometimes the standard stretch gives a
distorted view. For example a cloud is very bright and the rest of
the objects are then dull.
Source: sun
Sensor itself determines what the
image is going to look like, so the
characteristics are important.
We do not use much of the E part.
Interpretation is important by
understanding the other parts.
There are a lot of different sensors. Airborne or spaceborne. The spectral bands, spatial resolution,
field of view, orbit (geostationary and polar) and systems (active or passive) are important.
- Spatial resolution: pixel size: chooses the smallest
object you can see
- Frequency vs pixel size is important
- Netherlands: satellietdataportaal.nl
- ESA: european
,Data products are often available with standard processing: geometric correction, sensor calibration
(toa radiance), calibrate for incoming light (toa reflectance), atmospheric and terrain correction (toa
surface reflectance) and quality flags (water, snow, haze labels).
Radiometric calibration: when there are whole numbers, they are often not calibrated. The first step
is to correct for the sensor sensitivity. This gives you raw numbers which you can transform into
radiance, and then the radiance into reflectance. Reflectance is between 0-1 and is the amount of
incoming light which is reflected.
Ways of viewing an images:
- Histogram: which part of the image has lots of information: shows peaks
- Feature space: bright (clouds) and dark (sea)
- Image space
- Spectral signature
We use all of this for interpretation and analysis
- Classification
- NDVI
You can use it for example: wild fires, storms (damage assessment), biomass production, water
quality, deforestation and change detection (glaciers)
,Lecture 2: Imaging Spectroscopy
Satellites, airplanes, drones and ships
Imaging spectrometry: works with hundreds of spectral bands in the soparticle spectrum (0.4 - 2.5
μm). Each pixel has an associated, continuous spectrum that can be used to identify surface
materials. There are absorption features: chemicals present at that specific place at the earth's
surface. We need narrow spectral bands and have a lot of information. We have image cubes:
spectral information in a vertical way. It gives a full spectrum and relates to chemical constituents at
the earth’s surface. Absorption features.
Vegetation reflects a lot of NIR and water absorbs a lot.
Imaging spectrometers acquire images in a
large number (over 40 and up to 400),
narrow (0.01 to 0.02 um), contiguous (i.e.
adjacent) spectral bands to enable the
extraction of reflectance spectra (spectral
signatures) at a pixel scale that can be
directly compared with similar spectra
measured in the field or laboratory.
- Spectrometry: measuring
- Spectroscopy: ‘seeing’, ‘sensing’
- Hyperspectral: (too) many bands
Optical: 0.40-2.5 um (400-2500nm).
Thermal: 3.0-14 um.
Aim:
- A more quantitative approach: absorption bands, full spectral shape
- Intersect: we measure upwelling radiance, emissivity, radiant temperature and reflectance ->
translate into information
Applications: Vegetation & crop properties, soils, minerals, geology, atmosphere, water parameters,
snow and ice hydrology, mining, human infrastructure, etc.
, When plants are diminished. Plant stops photosynthesis, the absorption of NIR disappears, and then
the water content diminishes, so the water absorption bands also disappear.
Why are there absorption features in the spectra of the Earth's surface and the atmosphere?
- Electronic transition of electrons in atoms: electrons go higher orbit and that energy that is
needed coincide with bands in the spectrum.
- Vibrational transition of atom/molecules: absorbs the specific amount of energy with a
specific band: stretching, asymmetric stretching and bending.
o Stretching modes; symmetrical, anti-symmetrical, scissoring, rocking, wagging and
twisting. This can relate to absorption bands of hydrogen etc.
We have overtones of absorption bands. Absorption bands for water Overtones in solar-EM: Major:
1.4-1.9 µm Minor: 0.9-1.1 µm.
Minerals:
- Kaolonite has a very specific dip (2200 nm)
- Hematitie: abosprtion around 900 nm
- Calcite around 2300 nm
With spectrometry image you can asses vegetation health (take into the field to see what happens to
the crop).