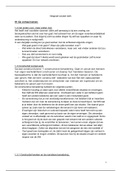
4/09
Chapter 1: Sampling distribution
Statistical inference is about estimation and null hypothesis testing. We have collected data
on a random sample and we want to draw conclusions (make inferences) about the
population from which the sample was drawn.
The sample does not offer a perfect miniature image of the population
if we would draw another sample from the same population, it would most likely to
present different characteristics
The value of a variable may vary from sample to sample. It is a random variable
because the score depends on chance, namely the chance that particular elements are drawn
during random sampling.
1.1 Statistical inference
Scientific theories strive for general statements – that apply to many situations.
Inferential statistics offers techniques for making statements about a larger set of
observations from data collected for a smaller set of observations
Population: The large set of observations about which we want to make a statement
Sample: The smaller set
We want to generalize a statement about the sample to a statement about the population
from which the sample was drawn.
1.2 Sample statistic
The number of yellow candies in a bag is an example of a sample statistic: a number
describing a characteristic of the sample
Each bag, that is, each sample, has one outcome score on the sample statistic. For
instance, one bag contains four yellow candies, another bag contains seven, and so on
All possible outcome scores constitute the sampling space
A bag of ten candies may contain 0, 1, 2, 3, 4, 5, 6, 7, 8, 9, or 10 yellow candies. The
numbers 0 to 10 are the sampling space of the sample statistic number of yellow
candies in a bag.
1
,1.3 Sampling distribution
Sampling distribution: The distribution of the outcome scores of very many samples – It’s
the link in between sample and population.
The sampling distribution tells us all possible samples that we could have drawn.
If we consider the figure that displays the probability distribution of the number of yellow
candies per bag of ten candies. This is an example of a discrete probability distribution
because only a limited number of outcomes are possible. It is possible to list the
probability of each outcome separately (i.e. it is not infinite) – from 0 yellow to 10
The sampling distribution as a probability distribution tells us:
1. Which outcomes we can expect – how many yellow candies we may find in our bag of 10
candies
2. Probability that a particular outcome may occur
If the sample is drawn from a population in which 20% of candies are yellow, we are quite likely to
find 0, 1, 2, 3, or 4 yellow candies in our bag. A bag with 5 yellow candies would be rare, 6 or 7
candies would be very rare, and a bag with more than 7 yellow candies is extremely unlikely but not
impossible
1.4 Expected value or expectation
The expected value is the average of the sampling distribution of a random variable
The value most likely to occur
The expected value of the proportion of yellow candies in the sample is equal to the
proportion of yellow candies in the population.
2
,1.5 Unbiased estimator
The expected value of the proportion of yellow candies in the bag (sample statistic) equals
the true proportion of yellow candies in the candy factory (population statistic). For this
reason, the sample proportion is an unbiased estimator of the proportion in the
population. More generally, a sample statistic is an unbiased estimator of the population
statistic if the expected value (mean of the sampling distribution) is equal to the population
statistic.
Unbiased estimator mean of the sampling distribution can be regarded as to be
equal to the population mean
1.6 A continuous random variable: Overweight and Underweight
Use a sample statistic so to know something about ‘average candy weight’ in a sample? If we
would want to know the probability of drawing a sample bag with an average candy
weight of 2.8 grams, we should exclude sample bags with an average candy weight of 2.81
grams, or 2.801 grams, or 2.8000000001 grams, and so on Probability of drawing such a
sample bag is for all practical purposes zero and negligible
Weight is a continuous variable because we can always think of a new weight between two other
weights: candy #1 weights 2.8 and candy #2 weights 2.81 though there are many other values in
between these two weights
Hence, instead of looking at specific values we look at a range of values
Can choose one threshold e.g. 2.8 grams and talk about the probability of having a
sample bag with an average candy weight of at least 2.8 grams or at most 2.8
grams
Can choose two thresholds and talk about the probability of an average candy
weight between 2.75 and 2.85 grams
We link probabilities to a range of values on the x-axis area between the
horizontal axis and a curve the curve is called probability density function
3
, The probability of values up to (and including) the threshold value or the threshold
value and higher are called p values. The probability of values up to (and including) the
threshold value is known as the left-hand p value and the probability of values above (and
including) the threshold value is called the right-hand p value.
Displayed probabilities always add up to one
1.7 Means at 3 levels
1. Population
Population statistic (or parameter)
E.g. the average weight of all candies
2. Sampling distribution
A distribution of sample means which also has a mean (aka expected value or
expectation of the sampling distribution)
The mean of the sampling distribution is the average of the average weight of
candies across all possible sample bags a mean of means (e.g. the mean of the
mean age most likely to be found among different samples)
3. Sample
Values of a sample statistic vary across random samples from the same
population. But some values are more probable than other values.
4