HC 1:
Random variable: any variable whose value cannot be predicted exactly. There are discrete (specific
set of possible values) and continuous (a continuous range of values) variables. The population is the
set of all possible values of the random variable.
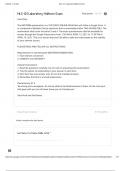
The three important rules with respect to expected values:
The three most used rules with respect to variances:
Type I error: alpha, the situation that you reject your null hypothesis, while the hypothesis is correct.
Type II error: the situation that you fail to reject your null hypothesis, while the hypothesis is
incorrect.
Use t-distribution if variance is not known.
,HC 2: univariate/simple regression model
y i = cross sectional (data at one moment in time on different entities)
y t = time series (data over a number of time periods on one entity)
y it = panel data (combining both types/data on different entities throughout time)
We use an error term because of several reasons:
Omission of explanatory variables
Measurement error
Functional misspecification
Aggregation of variables
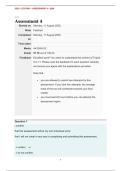
Using the technique of ordinary least squares (OLS) you minimize the sum of squared residuals (SSR),
to fit the line in your regression model.
So:
With a regression model you want to explain as much variation of your y as possible. The variation is
given by the total sum of squares (TSS) so if we divide the explained sum of squares (ESS) by the TSS
we get the coefficient of determination ( R2), which tells you how much variation your regression
model explains. In essence by estimating a regression model you maximize the R-squared.
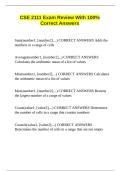
, The F-test tests if all your parameters (e.g. H 0 : β 2=β 3=β 4=0) explain your dependent variable:
The F-crit of this test is given by:
To perform a t-test on the significance of individual estimated coefficients ( H 0 : β 2=0) we can use
the following formula for t-calc:
HC 3: multivariate regressive
The Fritsch-Waugh-Lovell theorem states that with multiple regression the parameters can be
1
interpreted as an increase in X1 leads to an increase in Y with X 1∗β , if the other variables are held
constant! This is different from univariate regression where you can interpret the parameters as: if
X1 increases Y increases with X 1∗β1 .
Statistical significance is different from economic significance. Statistical significance happens when
a test points out that the parameter is significant from, for example 0. Economic significance signifies
that the parameter actually adds something of value to the model. Economic significance is
calculated by multiplying the ^β i with the standard deviation of X i the interpretation of this is that a
one std rise in X i will affect Yi on average by that number.
The assumptions that are made with respect to the regression model signify if the model can be
done with OLS. Such that the model needs to be linear in the parameters and correctly specified (A1)
etc. for it to be done with OLS. Additionally, there needs to be no exact linear relationship among
the regressors in the sample, which is called (perfect) multicollinearity (A2). The following
assumptions are the same as for the univariate regression model and all deal with the disturbance
term: the disturbance term has zero expectation (A3), there are homoscedastic disturbance terms
(A4), the disturbance terms are not correlated with each other (A5) and the disturbance terms are
normally distributed (A6).
A model is efficient if it has the smallest standard error and is unbiased if all the predicted betas of
models give the correct population betas. Unbiasedness in formula terms is: E ( ^β )= β
2
The precision of a model relates to σ u (variance of the regression) because if the variance of
observations from the line is low the precision of the model increases. The precision of a model
relates to the number of observations n because the greater the observations in the sample the
more the parameters look like the population parameters.
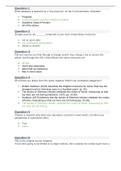
The following equation shows us that if the correlation between variables increases the precision of
the model (as measured by the standard error of the estimated parameters) decreases. Additionally
it shows us that if Mean Squared Deviation (MSD) needs to increase for the precision to increase
Random variable: any variable whose value cannot be predicted exactly. There are discrete (specific
set of possible values) and continuous (a continuous range of values) variables. The population is the
set of all possible values of the random variable.
The three important rules with respect to expected values:
The three most used rules with respect to variances:
Type I error: alpha, the situation that you reject your null hypothesis, while the hypothesis is correct.
Type II error: the situation that you fail to reject your null hypothesis, while the hypothesis is
incorrect.
Use t-distribution if variance is not known.
,HC 2: univariate/simple regression model
y i = cross sectional (data at one moment in time on different entities)
y t = time series (data over a number of time periods on one entity)
y it = panel data (combining both types/data on different entities throughout time)
We use an error term because of several reasons:
Omission of explanatory variables
Measurement error
Functional misspecification
Aggregation of variables
Using the technique of ordinary least squares (OLS) you minimize the sum of squared residuals (SSR),
to fit the line in your regression model.
So:
With a regression model you want to explain as much variation of your y as possible. The variation is
given by the total sum of squares (TSS) so if we divide the explained sum of squares (ESS) by the TSS
we get the coefficient of determination ( R2), which tells you how much variation your regression
model explains. In essence by estimating a regression model you maximize the R-squared.
, The F-test tests if all your parameters (e.g. H 0 : β 2=β 3=β 4=0) explain your dependent variable:
The F-crit of this test is given by:
To perform a t-test on the significance of individual estimated coefficients ( H 0 : β 2=0) we can use
the following formula for t-calc:
HC 3: multivariate regressive
The Fritsch-Waugh-Lovell theorem states that with multiple regression the parameters can be
1
interpreted as an increase in X1 leads to an increase in Y with X 1∗β , if the other variables are held
constant! This is different from univariate regression where you can interpret the parameters as: if
X1 increases Y increases with X 1∗β1 .
Statistical significance is different from economic significance. Statistical significance happens when
a test points out that the parameter is significant from, for example 0. Economic significance signifies
that the parameter actually adds something of value to the model. Economic significance is
calculated by multiplying the ^β i with the standard deviation of X i the interpretation of this is that a
one std rise in X i will affect Yi on average by that number.
The assumptions that are made with respect to the regression model signify if the model can be
done with OLS. Such that the model needs to be linear in the parameters and correctly specified (A1)
etc. for it to be done with OLS. Additionally, there needs to be no exact linear relationship among
the regressors in the sample, which is called (perfect) multicollinearity (A2). The following
assumptions are the same as for the univariate regression model and all deal with the disturbance
term: the disturbance term has zero expectation (A3), there are homoscedastic disturbance terms
(A4), the disturbance terms are not correlated with each other (A5) and the disturbance terms are
normally distributed (A6).
A model is efficient if it has the smallest standard error and is unbiased if all the predicted betas of
models give the correct population betas. Unbiasedness in formula terms is: E ( ^β )= β
2
The precision of a model relates to σ u (variance of the regression) because if the variance of
observations from the line is low the precision of the model increases. The precision of a model
relates to the number of observations n because the greater the observations in the sample the
more the parameters look like the population parameters.
The following equation shows us that if the correlation between variables increases the precision of
the model (as measured by the standard error of the estimated parameters) decreases. Additionally
it shows us that if Mean Squared Deviation (MSD) needs to increase for the precision to increase