Multiple regression /Correlation with 2+ IVs
Basics of Simple linear regression:
Regression Model = a simple approximation for the relationship between variables. Association does
not imply causation!
- Regression can be useful in structuring and predicting something.
Ordinary Least Square (OLS) method: the line where you have the least error between the observed
data points and the estimated residuals. Least squared because you square them.
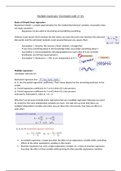
- Assumption 1. linearity: We assume a linear relation: a straight line
If you know something about X, this knowledge helps you predict something about Y
- Assumption 2. homoscedasticity: All subpopulations for each value of X are normally
distributed, and all have equal spread σ.
- Assumption 3. Residuals εi ∼ N(0, σ) are independent of X >>
Multiple regression:
Correlation with two IVs
Estimated regression line:
b1, b2 are the partial regression coefficients. Their values depend on the remaining predictors in the
model.
b1: Partial regression coefficient for Y on X1 when X2 is also present.
b2: Partial regression coefficient for Y on X2 when X1 is also present.
Intercept b0: Estimated Yb when X1 = X2 = 0.
Why don’t we do several simple linear regressions but use a multiple regression? Because you want
to control for the extra independent variables you have. You take into account that there are
multiple independent variables and when you put them into one formula, they have an effect on
each other.
• In multiple regression, a slope describes the effect of an explanatory variable while controlling
effects of the other explanatory variables in the model.
• Bivariate regression has only a single explanatory variable. So, a slope in bivariate regression
describes the effect of that variable while ignoring all other possible explanatory variables.
, The sample multiple correlation for a regression model, denoted by R, is the correlation between the
observed y-values and the predicted ŷ-values.
R always falls between 0 and 1. So, the correlation between y and ŷ differs from the correlation
between y and an explanatory variable x, which falls between −1 and +1.
R2 measures the proportion of the total variation in y that is explained by the predictive power of all
the explanatory variables, through the multiple regression model.
How well do all the IV’s together estimate/explain Y? Use multiple R and R 2
RY.12 = rYY12 = Correlation between Y and ŷ12 = b0 + b1X1 + b2X2.
R2Y.12 = Percentage of variance of Y explained by the IVs.
The properties of R2 are similar to those of r2 for bivariate models.
• R2 falls between 0 and 1.
• The larger the value of R2, the better the set of explanatory variables (x1,...,xp) collectively
predicts y.
• R2 =1 only when all the residuals are 0, that is, when all y= ŷ, so that predictions are perfect
and SSE=0.
• R2 = 0 when the predictions do not vary as any of the x-values vary. In that case, b1 = b2
=···=bp = 0, and ŷ is identical to ȳ, since the explanatory variables do not add any predictive
power. The correlation is then 0 between y and each explanatory variable.
• R2 cannot decrease when we add an explanatory variable to the model. It is impossible to
explain less variation in y by adding explanatory variables to a regression model.
• R2 for the multiple regression model is at least as large as the r2-values for the separate
bivariate models. That is, R2 for the multiple regression model is at least as large as r2 yx1 for
y as a linear function of x1,r2 yx2 for y as a linear function of x2, and so forth.
• R2 tends to overestimate the population value, because the sample data fall closer to the
sample prediction equation than to the true population regression equation. Most software
also reports a less biased estimate, called adjusted R2.
Multicollinearity= (not a good thing!) Too much overlap between independent variables does not
uniquely add much to the model.
Multicollinearity is less severe for larger sample sizes. Ideally, the sample size should be at least
about 10 times the number of explanatory variables (for example, at least about 40 for 4 explanatory
variables).
Semipartial/partial correlation coefficients
The ‘regular’ multiple correlation coefficient, RY.12, provides information about how well all IVs
together can be used to estimate/predict Y.
What about the isolated contribution of each IV to estimate Y? The answer is not straightforward
since IVs usually correlate.
Basics of Simple linear regression:
Regression Model = a simple approximation for the relationship between variables. Association does
not imply causation!
- Regression can be useful in structuring and predicting something.
Ordinary Least Square (OLS) method: the line where you have the least error between the observed
data points and the estimated residuals. Least squared because you square them.
- Assumption 1. linearity: We assume a linear relation: a straight line
If you know something about X, this knowledge helps you predict something about Y
- Assumption 2. homoscedasticity: All subpopulations for each value of X are normally
distributed, and all have equal spread σ.
- Assumption 3. Residuals εi ∼ N(0, σ) are independent of X >>
Multiple regression:
Correlation with two IVs
Estimated regression line:
b1, b2 are the partial regression coefficients. Their values depend on the remaining predictors in the
model.
b1: Partial regression coefficient for Y on X1 when X2 is also present.
b2: Partial regression coefficient for Y on X2 when X1 is also present.
Intercept b0: Estimated Yb when X1 = X2 = 0.
Why don’t we do several simple linear regressions but use a multiple regression? Because you want
to control for the extra independent variables you have. You take into account that there are
multiple independent variables and when you put them into one formula, they have an effect on
each other.
• In multiple regression, a slope describes the effect of an explanatory variable while controlling
effects of the other explanatory variables in the model.
• Bivariate regression has only a single explanatory variable. So, a slope in bivariate regression
describes the effect of that variable while ignoring all other possible explanatory variables.
, The sample multiple correlation for a regression model, denoted by R, is the correlation between the
observed y-values and the predicted ŷ-values.
R always falls between 0 and 1. So, the correlation between y and ŷ differs from the correlation
between y and an explanatory variable x, which falls between −1 and +1.
R2 measures the proportion of the total variation in y that is explained by the predictive power of all
the explanatory variables, through the multiple regression model.
How well do all the IV’s together estimate/explain Y? Use multiple R and R 2
RY.12 = rYY12 = Correlation between Y and ŷ12 = b0 + b1X1 + b2X2.
R2Y.12 = Percentage of variance of Y explained by the IVs.
The properties of R2 are similar to those of r2 for bivariate models.
• R2 falls between 0 and 1.
• The larger the value of R2, the better the set of explanatory variables (x1,...,xp) collectively
predicts y.
• R2 =1 only when all the residuals are 0, that is, when all y= ŷ, so that predictions are perfect
and SSE=0.
• R2 = 0 when the predictions do not vary as any of the x-values vary. In that case, b1 = b2
=···=bp = 0, and ŷ is identical to ȳ, since the explanatory variables do not add any predictive
power. The correlation is then 0 between y and each explanatory variable.
• R2 cannot decrease when we add an explanatory variable to the model. It is impossible to
explain less variation in y by adding explanatory variables to a regression model.
• R2 for the multiple regression model is at least as large as the r2-values for the separate
bivariate models. That is, R2 for the multiple regression model is at least as large as r2 yx1 for
y as a linear function of x1,r2 yx2 for y as a linear function of x2, and so forth.
• R2 tends to overestimate the population value, because the sample data fall closer to the
sample prediction equation than to the true population regression equation. Most software
also reports a less biased estimate, called adjusted R2.
Multicollinearity= (not a good thing!) Too much overlap between independent variables does not
uniquely add much to the model.
Multicollinearity is less severe for larger sample sizes. Ideally, the sample size should be at least
about 10 times the number of explanatory variables (for example, at least about 40 for 4 explanatory
variables).
Semipartial/partial correlation coefficients
The ‘regular’ multiple correlation coefficient, RY.12, provides information about how well all IVs
together can be used to estimate/predict Y.
What about the isolated contribution of each IV to estimate Y? The answer is not straightforward
since IVs usually correlate.