Week 1: Macroeconomics and the trade-off of unemployment and inflation
KW 12: MACROECONOMICS - THE BIG PICTURE
Theory and Policy
Before the 1930s, economists regarded the economy as self-regulating: problems such as unemployment were
resolved without government intervention, through the working of the 'invisible hand’. The Great Depression changed
this, economists instead looked for ways to prevent these problems.
Paradox of shift: when families and business are worried about the possibility of economic hard times, they prepare
by cutting their spending. This depresses the economy as consumers spend less and businesses react by laying off
workers. As a result, families and businesses may end up worse off.
• Profligate behaviour: when families and businesses feel optimistic about the future, they spend more today. This
stimulates the economy, leading to businesses hiring more workers and further expansion of the economy.
Keynesian Economics
• “The General Theory of Employment, Interest and Money” - 1936, Keynes
• Keynes believed that a depressed economy is the result of inadequate spending
• He argued that government intervention can help a depressed economy through:
1. Monetary policy: uses changes in the quantity of money to alter interest rates, which in turn affect the level
of overall spending.
2. Fiscal policy: uses changes in taxes and government spending to affect overall spending
• Idea that managing the economy is a government responsibility.
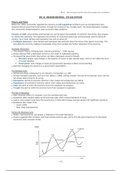
The Business Cycle
• Vertical axis shows employment or an indicator of production e.g. GDP.
• During prolonged expansion, such as in the 1960s or 1990s, articles proclaim ‘the end of the business cycle’, but this
has always been proved to be wrong.
• Recessions: periods of economic downturn when output and employment are falling.
• Expansions: are periods of economic upturn when output and employment are rising.
• Peak: the point at which the economy turns from expansion to recession.
• Trough: the point at which the economy turns from recession to expansion.
The Pain of Recession
• Most important effect of a recession is on the unemployment rate.
• Recessions affect people's ability to find and keep jobs, which impacts standards of living.
• Lead to more people living below the poverty line or losing their houses, and less people with healthcare insurance.
• Recessions also impact firms:
- Lower profits
- Many small businesses fail
Taming the Business Cycle
• Modern macroeconomics was largely a response to The Great Depression
• Keynes suggested that monetary and fiscal policies could be used, and to this day governments turn to Keynesian
economics when recession strikes
1 of 22
,Long-run Economic Growth
Long-run economic growth: the sustained upward trend in the economy’s output over time.
• Partly because of growing populations and workforce.
• Fundamental to many pressing policy issues today e.g. a country’s ability to bear future costs.
• When growth slows it feeds a national mood of pessimism.
Long-run growth per capita: sustained upward trend in output per person.
• Key to higher wages and rising standards of living.
• Important in poorer, less developed countries which want to improve standards of living.
• Macroeconomists do not use the same models for long-run growth and the business cycle, because what is good in
the long run can be bad in the short run and vice versa.
• Paradox of shift: an attempt by households to increase their savings can cause a recession, but a higher level of
savings plays a crucial role in encouraging long-run economic growth
Inflation and Deflation
Inflation: a rise in the overall level of prices
Deflation: a fall in the overall level of prices
The causes of inflation and deflation
• Supply and demand can only explain why a particular good or service becomes more expensive relative to other
goods and services.
• It cannot explain why the price has risen over time in spite of the fact that production has become more efficient and
the good has become cheaper compared to other goods.
• In the short-run, movements in inflation are closely related to the business cycle.
- Depression → inflation falls
- Boom → inflation rises
• In the long-run, the overall level of prices is determined by changes in the money supply: the total quantity of
assets that can be readily used to make purchases
The pain of inflation and deflation
• Inflation discourages people from holding onto cash, because it loses value over time if the overall price level is
rising. That is, the amount of goods and services you can buy with a given amount of cash falls. In extreme cases,
people stop holding cash altogether and turn to barter.
• Deflation causes cash to gain value over time, so holding onto it becomes more attractive than investing in new
assets. This can deepen a recession.
Price-stability: when the overall level of prices changes slowly or not at all.
• This is considered a desirable goal by economists.
International Imbalances
Open economy: economy that trades goods and services with other countries
Trade deficit: when the value of goods and services bought from foreigners is more than the value of goods and
services it sells to them
Trade surplus: when the value of goods and services bought from foreigners is less than the value of the goods and
services it sells to them
Relationship:
There is no simple relationship between the success of an economy and whether it runs trade surpluses or deficits. A
country having a highly productive workforce or widely desired products or services to sell does not mean they will
have a trade surplus.
This is instead caused by decisions about savings and investment spendings.
• Investment spending > Savings → Trade deficits
• Investment spending < Savings → Trade surpluses
2 of 22
, KW 13: GDP AND CPI
Measuring the Macroeconomy
The national income and product accounts:
• Track the flows of money between different sectors of the economy
• Economists use this to measure the overall market value of the goods and services the economy produces → GDP
Final goods and services: goods and services sold to the final/end user
Intermediate goods and services: goods and services bought from one firm by another firm that are used as inputs
for production of final goods and services
Gross Domestic Product
Gross Domestic Product: the total value of all final goods and services produced in the economy during a given year
• Used to compare economic performance between years or different countries
• Issue: can increase by an increase in the prices of goods and services rather than an increase in output
Calculating GDP
1. Measuring GDP as a value of production of final goods and services
• Value of all the final goods and services produced in the economy
• Excludes the value of intermediate goods and services
• To avoid double-counting, we only count each producer’s value added: this is the difference between the value
of its sales and the value of the intermediate goods and services it purchases from other businesses
2. Measuring GDP as spending on domestically produced final goods and services
• Aggregate spending on domestically produced final goods and services
• GDP can be measured by the flow of funds into firms, but this must avoid double-counting
• This method only counts the value of sales to final buyers → such as consumers, firms that purchase
investment goods, the government or foreign buyers
• Sales of inputs from one business to another are excluded to prevent double-counting
• National accounts include investment spending of firms as part of final spending
3. Measuring GDP as factor income earned from firms in the economy
• Income earned by factors of production → wages, interest, rent, dividends
• The money firms earn by selling goods and services must go somewhere
Real GDP: A Measure of Aggregate Output
Nominal GDP: the total value of all final goods and services produced in the economy during a given year, calculated
using the current prices in the year in which the output is produced
Real GDP: the total value of all final goods and services produced in the economy during a given year, calculated
using the prices of a selected base year
• GDP is not a good measure of the economy’s growth over time
- GDP can grow because the economy grows, but it can also grow because of inflation
- Even if output does not increase, GDP will increase because prices have increased
• Real GDP measures actual changes in aggregate output since it is adjusted for price changes
• Government economists use chain linking to measure the change in real GDP
- Chain dollars: the method of calculating changes in real GDP using the average between the growth rate
calculated using an early base year and the growth rate calculated using a late base year
• Increase in Real GDP → an expansion in the economy’s production possibility frontier
- Shows that the country has increased its production capacity, but this does not mean this increase capacity is
used to improve standards of living
GDP per capita: an economy’s average aggregate output per person
• This is used when we want to compare GDP across countries because it eliminates the effect of differences in
population size
• Real GDP per capita has limitations as a measure of a country’s standard of living
- Does not measure human welfare
- Growth in Real GDP per capita is not an appropriate policy goal because it has nothing to do with the quality
of life
3 of 22
KW 12: MACROECONOMICS - THE BIG PICTURE
Theory and Policy
Before the 1930s, economists regarded the economy as self-regulating: problems such as unemployment were
resolved without government intervention, through the working of the 'invisible hand’. The Great Depression changed
this, economists instead looked for ways to prevent these problems.
Paradox of shift: when families and business are worried about the possibility of economic hard times, they prepare
by cutting their spending. This depresses the economy as consumers spend less and businesses react by laying off
workers. As a result, families and businesses may end up worse off.
• Profligate behaviour: when families and businesses feel optimistic about the future, they spend more today. This
stimulates the economy, leading to businesses hiring more workers and further expansion of the economy.
Keynesian Economics
• “The General Theory of Employment, Interest and Money” - 1936, Keynes
• Keynes believed that a depressed economy is the result of inadequate spending
• He argued that government intervention can help a depressed economy through:
1. Monetary policy: uses changes in the quantity of money to alter interest rates, which in turn affect the level
of overall spending.
2. Fiscal policy: uses changes in taxes and government spending to affect overall spending
• Idea that managing the economy is a government responsibility.
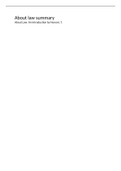
The Business Cycle
• Vertical axis shows employment or an indicator of production e.g. GDP.
• During prolonged expansion, such as in the 1960s or 1990s, articles proclaim ‘the end of the business cycle’, but this
has always been proved to be wrong.
• Recessions: periods of economic downturn when output and employment are falling.
• Expansions: are periods of economic upturn when output and employment are rising.
• Peak: the point at which the economy turns from expansion to recession.
• Trough: the point at which the economy turns from recession to expansion.
The Pain of Recession
• Most important effect of a recession is on the unemployment rate.
• Recessions affect people's ability to find and keep jobs, which impacts standards of living.
• Lead to more people living below the poverty line or losing their houses, and less people with healthcare insurance.
• Recessions also impact firms:
- Lower profits
- Many small businesses fail
Taming the Business Cycle
• Modern macroeconomics was largely a response to The Great Depression
• Keynes suggested that monetary and fiscal policies could be used, and to this day governments turn to Keynesian
economics when recession strikes
1 of 22
,Long-run Economic Growth
Long-run economic growth: the sustained upward trend in the economy’s output over time.
• Partly because of growing populations and workforce.
• Fundamental to many pressing policy issues today e.g. a country’s ability to bear future costs.
• When growth slows it feeds a national mood of pessimism.
Long-run growth per capita: sustained upward trend in output per person.
• Key to higher wages and rising standards of living.
• Important in poorer, less developed countries which want to improve standards of living.
• Macroeconomists do not use the same models for long-run growth and the business cycle, because what is good in
the long run can be bad in the short run and vice versa.
• Paradox of shift: an attempt by households to increase their savings can cause a recession, but a higher level of
savings plays a crucial role in encouraging long-run economic growth
Inflation and Deflation
Inflation: a rise in the overall level of prices
Deflation: a fall in the overall level of prices
The causes of inflation and deflation
• Supply and demand can only explain why a particular good or service becomes more expensive relative to other
goods and services.
• It cannot explain why the price has risen over time in spite of the fact that production has become more efficient and
the good has become cheaper compared to other goods.
• In the short-run, movements in inflation are closely related to the business cycle.
- Depression → inflation falls
- Boom → inflation rises
• In the long-run, the overall level of prices is determined by changes in the money supply: the total quantity of
assets that can be readily used to make purchases
The pain of inflation and deflation
• Inflation discourages people from holding onto cash, because it loses value over time if the overall price level is
rising. That is, the amount of goods and services you can buy with a given amount of cash falls. In extreme cases,
people stop holding cash altogether and turn to barter.
• Deflation causes cash to gain value over time, so holding onto it becomes more attractive than investing in new
assets. This can deepen a recession.
Price-stability: when the overall level of prices changes slowly or not at all.
• This is considered a desirable goal by economists.
International Imbalances
Open economy: economy that trades goods and services with other countries
Trade deficit: when the value of goods and services bought from foreigners is more than the value of goods and
services it sells to them
Trade surplus: when the value of goods and services bought from foreigners is less than the value of the goods and
services it sells to them
Relationship:
There is no simple relationship between the success of an economy and whether it runs trade surpluses or deficits. A
country having a highly productive workforce or widely desired products or services to sell does not mean they will
have a trade surplus.
This is instead caused by decisions about savings and investment spendings.
• Investment spending > Savings → Trade deficits
• Investment spending < Savings → Trade surpluses
2 of 22
, KW 13: GDP AND CPI
Measuring the Macroeconomy
The national income and product accounts:
• Track the flows of money between different sectors of the economy
• Economists use this to measure the overall market value of the goods and services the economy produces → GDP
Final goods and services: goods and services sold to the final/end user
Intermediate goods and services: goods and services bought from one firm by another firm that are used as inputs
for production of final goods and services
Gross Domestic Product
Gross Domestic Product: the total value of all final goods and services produced in the economy during a given year
• Used to compare economic performance between years or different countries
• Issue: can increase by an increase in the prices of goods and services rather than an increase in output
Calculating GDP
1. Measuring GDP as a value of production of final goods and services
• Value of all the final goods and services produced in the economy
• Excludes the value of intermediate goods and services
• To avoid double-counting, we only count each producer’s value added: this is the difference between the value
of its sales and the value of the intermediate goods and services it purchases from other businesses
2. Measuring GDP as spending on domestically produced final goods and services
• Aggregate spending on domestically produced final goods and services
• GDP can be measured by the flow of funds into firms, but this must avoid double-counting
• This method only counts the value of sales to final buyers → such as consumers, firms that purchase
investment goods, the government or foreign buyers
• Sales of inputs from one business to another are excluded to prevent double-counting
• National accounts include investment spending of firms as part of final spending
3. Measuring GDP as factor income earned from firms in the economy
• Income earned by factors of production → wages, interest, rent, dividends
• The money firms earn by selling goods and services must go somewhere
Real GDP: A Measure of Aggregate Output
Nominal GDP: the total value of all final goods and services produced in the economy during a given year, calculated
using the current prices in the year in which the output is produced
Real GDP: the total value of all final goods and services produced in the economy during a given year, calculated
using the prices of a selected base year
• GDP is not a good measure of the economy’s growth over time
- GDP can grow because the economy grows, but it can also grow because of inflation
- Even if output does not increase, GDP will increase because prices have increased
• Real GDP measures actual changes in aggregate output since it is adjusted for price changes
• Government economists use chain linking to measure the change in real GDP
- Chain dollars: the method of calculating changes in real GDP using the average between the growth rate
calculated using an early base year and the growth rate calculated using a late base year
• Increase in Real GDP → an expansion in the economy’s production possibility frontier
- Shows that the country has increased its production capacity, but this does not mean this increase capacity is
used to improve standards of living
GDP per capita: an economy’s average aggregate output per person
• This is used when we want to compare GDP across countries because it eliminates the effect of differences in
population size
• Real GDP per capita has limitations as a measure of a country’s standard of living
- Does not measure human welfare
- Growth in Real GDP per capita is not an appropriate policy goal because it has nothing to do with the quality
of life
3 of 22