CHAPTER 2: ECONOMIC MODELS: TRADE-OFFS AND TRADE
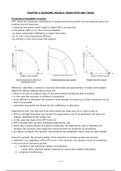
Production Possibility Frontier
PPF: shows the maximum combination of goods and services which can be produced given the
existing level of resources
• resources are scarce which leads to trade-offs in an economy
• only points within or on the curve are feasible
• A shows productive inefficiency (unused resources)
• C, D, and C are productively efficient
• to achieve X, the curve must first expand
Usually convex due to the law of Expands during economic growth Straight line with constant
diminishing returns
Efficiency: describes a market or economy that takes all opportunities to make some people
better off without making others worse off
• there is no way to produce more of one good without producing less of another
• in this case the economy is efficient in production
• to be efficient in allocation the economy must allocate its resources so that consumers are as
well of as possible
• command economies are known for the inefficiency in allocation
Opportunity cost: the real cost of an item (what you must give up in order to get it)
• PPF is a straight line when we assume the opportunity cost of an additional unit does not
change regardless of the output mix
• in this case the slope of the PPF is the OC
• PPF is bowed when we face increasing opportunity cost
• when only a small amount of a good is produced, the opportunity cost is relatively low
because the economy only needs the resources that are suited for its production
• as output increases, OC typically rises because less adaptable inputs must be used instead
Economic growth: the growing ability of the economy to produce goods and services
• reflected in an expansion of the PPF curve = the economy can produce more of everything
• two sources of economic growth:
1. increase in the economy’s factors of production
• land, labor, physical capital (machinery) and human capital (education)
2. progress in technology
1 of 39
,Comparative Advantage and Gains from Trade
- two countries two goods
- both can gain from trade
US:
- 3/4 large jet for one small jet
- 4/3 small jets for one large jet
Brazil:
- 1/3 large jet for one small jet
- 3 small jets for one large jet
Without trade:
- US produces and consumes 18 large jets and 16 small jets
- Brazil produces and consumes 8 large jets and 6 small jets
With trade:
- both countries will only accept a trade if the price of the good each country obtains in the
trade is less than its own opportunity cost of producing the good domestically
- US specialises in large jets: produces 30 and sells 10 to Brazil
- Brazil specialises in small jets: produces 30 and sells
- US gains 3 large jets and 4 small jets
- Brazil gains 2 large jets and 4 small jets
Comparative advantage: when the opportunity cost of producing the good or service is lower
the other countries’ opportunity cost
Absolute advantage: when a country can produce more output per worker than other countries
2 of 39
,The Circular-flow diagram
Barter: when people directly exchange goods or services the they have for goods or services
that they want
Two types of flows:
1. physical things (yellow): goods, services, labor and raw materials in one direction
2. money (green): opposite direction
Two types of inhabitants:
1. households: individuals or groups who share their income
2. firms: organisations who produces goods and services and employ members of households
Two types of markets:
1. goods and services: households buy the goods and services they want from firms, this
produces a flow of goods and services to households and a return flow of money to firms
2. factors: firms buy the resources they need to reduce goods and services (land, labor,
physical capital and human capital)
Income distribution: the way in which total income is distributed among the owners of the
various factors of production
• the circular flow diagram ignores a number of real-world complications
• the distinction between firms and households is not always so clear-cut
- example: family businesses
• many of the sales firms make are not to households but to other firms
• diagram does not include the government which diverts a lot of money out of the circular
flow in the forms of taxes, but also invests a lot of money back into the flow in the form of
spending
3 of 39
, CHAPTER 3: SUPPLY AND DEMAND
Competitive Market: when there are many buyers and sellers of the same good or service,
none of whom can influence the price at which the product is sold
- this does not include products that account for a high market share
The Demand Curve
Demand: the willingness and ability of customers to pay a certain price
- A demand schedule shows how much of a good or service consumers will want to buy at
different prices
- The quantity demanded is the actual amount of a good or service consumers are willing to
buy at some specific price
Law of demand: the quantity demanded for a good or service falls as its price rises
This negative relationship is causes by:
• the income effect: as price falls, real income of customers rises
• the substitution effect: as price falls, more customers can pay for it instead
• diminishing marginal returns: utility gained per marginal unit declines as more is consumed,
so customers will only purchase more at a lower price
A shift of the demand curve is a change in the quantity demanded at any given price,
represented by the shift of the original curve to a new position, denoted by a new demand
curve.
A movement along the demand curve is a change in the quantity demanded of a good arising
from a change in the good’s price.
Non-price determinants:
• population
• advertising
• substitutes
- a rise in price of one good leads to an increase in the demand for the other good
- pepsi vs coke
• income
- normal goods: when a rise in income increases the demand for the good, this is the case
for most goods
- inferior goods: when a rise in income decreases the demand for the good, this happens to
goods that are considered less desirable than other alternatives
• fashions and trends
- due to fads, beliefs, cultural shifts
• interest rate
• complements
- a rise in price of one good leads to a decrease in the demand for the other good
- pencils and erasers
Individual demand: demand for one consumer
- The market demand curve shows the horizontal sum of all individual demand curves
4 of 39