YSS 20306
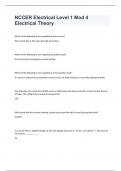
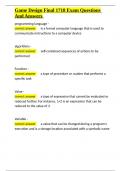
Quantitative Qualitative
Collecting & analyzing numbers Collecting & analyzing words
Counting Understanding (why, how)
Looking for regularities Looking for specifics
Standardized measurement instruments Researched is the measurement instrument
Mostly testing hypothesis / theory Mostly creating hypothesis / theory
Large sample of research units (random Small sample of research units
sampling)
Quantitative
Lecture 1
Research techniques = established, agreed-upon ways/tools by which we aim to get reliable
and valid results
● Reliable = replicable
● Valid = saying something about the thing you want to say something about
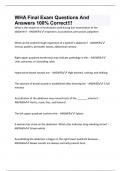
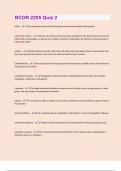
Independent sample t-test
The variables y=…
The parameter of interest μL = population mean of y for …
μG = population mean of y for …
δ = difference between the two population
means
δ = μL - μG
The null hypothesis Ho δ=0
The alternative hypothesis Ha δ>0
Test statistic
yL = sample mean
yG = sample mean
d = sample difference, point estimate of
parameter
SEd = estimated standard error of the
difference
Ho distribution of test statistic Under Ho, calculated t follows theoretical
t-distribution with N-2 degrees of freedom
,Lecture 2
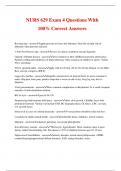
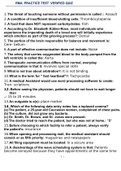
Dependence techniques
One More-than-one
Continuous; interval and Simple regression Multiple regression
ratio
Categorical Independent sample t-test & Factorial ANOVA
One Way ANOVA
Interdependence techniques
Two More-than-two
Continuous; interval and Correlation Exploratory factor analysis
ratio
Categorical Cross-tabulation Loglinear analysis
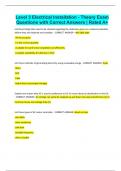
Covariance = measures the extent to which positive / negative deviations from the mean on
variable X1 (proportionally) go together with positive / negative deviations from the mean on
variable X2.
●
● For given variances of X1 and X2, covariance is the largest when observations are
on a straight line = a linear relation
Problems for the interpretation
- Covariance depends on units of the measurement scale
- Maximum value and minimum value of covariance also depend on units of
measurement scale
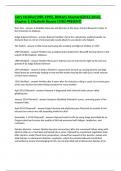
Pearson correlation = divide covariance by product of standard deviations
●
● Measure of strength of linear
relationship
● Does not depend on units of
the measurement scales
● Varies between 1 and -1
● Suppose Z1 and Z2 are the
standardized versions of X1
and X2, then:
r (X1, X2) = cov (Z1,
Z2) = r (Z1, Z2)
, T-test = , (df) N -2
Assumptions
● Independent observations
● Variables normally distributed
● Sample obtained by simple random sampling
Fisher z transformation =
Assumptions
● Independent observations
● Variables normally distributed
● Sample obtained by simple random sampling
Confidence intervals = estimate of the smallest interval in which 95% of the correlations will
fall, when we draw samples over and over again from the population.
R-squared = coefficient of determination (proportion of the variance accounted for)
● 0.01 is small
● 0.09 is medium
● 0.25 is large
Simple regression
● Regression weights / coefficients b0 (intercept) and b1 (slope) estimated such that
variance is as small as possible (Method of Least Squares)
Multiple correlation coefficient = R = = effect size
F-statistic assumptions:
● Independent observations
● e’s normally distributed
Standardized regression coefficient
Quantitative Qualitative
Collecting & analyzing numbers Collecting & analyzing words
Counting Understanding (why, how)
Looking for regularities Looking for specifics
Standardized measurement instruments Researched is the measurement instrument
Mostly testing hypothesis / theory Mostly creating hypothesis / theory
Large sample of research units (random Small sample of research units
sampling)
Quantitative
Lecture 1
Research techniques = established, agreed-upon ways/tools by which we aim to get reliable
and valid results
● Reliable = replicable
● Valid = saying something about the thing you want to say something about
Independent sample t-test
The variables y=…
The parameter of interest μL = population mean of y for …
μG = population mean of y for …
δ = difference between the two population
means
δ = μL - μG
The null hypothesis Ho δ=0
The alternative hypothesis Ha δ>0
Test statistic
yL = sample mean
yG = sample mean
d = sample difference, point estimate of
parameter
SEd = estimated standard error of the
difference
Ho distribution of test statistic Under Ho, calculated t follows theoretical
t-distribution with N-2 degrees of freedom
,Lecture 2
Dependence techniques
One More-than-one
Continuous; interval and Simple regression Multiple regression
ratio
Categorical Independent sample t-test & Factorial ANOVA
One Way ANOVA
Interdependence techniques
Two More-than-two
Continuous; interval and Correlation Exploratory factor analysis
ratio
Categorical Cross-tabulation Loglinear analysis
Covariance = measures the extent to which positive / negative deviations from the mean on
variable X1 (proportionally) go together with positive / negative deviations from the mean on
variable X2.
●
● For given variances of X1 and X2, covariance is the largest when observations are
on a straight line = a linear relation
Problems for the interpretation
- Covariance depends on units of the measurement scale
- Maximum value and minimum value of covariance also depend on units of
measurement scale
Pearson correlation = divide covariance by product of standard deviations
●
● Measure of strength of linear
relationship
● Does not depend on units of
the measurement scales
● Varies between 1 and -1
● Suppose Z1 and Z2 are the
standardized versions of X1
and X2, then:
r (X1, X2) = cov (Z1,
Z2) = r (Z1, Z2)
, T-test = , (df) N -2
Assumptions
● Independent observations
● Variables normally distributed
● Sample obtained by simple random sampling
Fisher z transformation =
Assumptions
● Independent observations
● Variables normally distributed
● Sample obtained by simple random sampling
Confidence intervals = estimate of the smallest interval in which 95% of the correlations will
fall, when we draw samples over and over again from the population.
R-squared = coefficient of determination (proportion of the variance accounted for)
● 0.01 is small
● 0.09 is medium
● 0.25 is large
Simple regression
● Regression weights / coefficients b0 (intercept) and b1 (slope) estimated such that
variance is as small as possible (Method of Least Squares)
Multiple correlation coefficient = R = = effect size
F-statistic assumptions:
● Independent observations
● e’s normally distributed
Standardized regression coefficient