Criteria covered by this task:
Unit/Criteria
To achieve the criteria, you must show that you are able to:
reference
Evaluate the accuracy of practical work in calorimetry in relation to the
B.D2 - R - Y
analysis of the cooling curve.
Analyse the rate of cooling of substances from your
B.M2 - R - Y
data using cooling curves to draw valid conclusions.
Correctly obtain data using different equipment to construct cooling
B.P3 - R - Y
curves.
Correctly determine the rate of cooling of substances using cooling
B.P4 - R - Y
curves.
I certify this is my own work:
U2.B: Calorimetry and Cooling curves.
Aim:
I would like to perform 4 cooling curve experiments. I will be using two substrates; one is stearic
acid and the other is paraffin wax. I will be cooling them in both air and water to then observe the
temperature time graphs for the 4 situations.
Hypothesis:
What do you think will happen in the experiment?
In this experiment, it is hypothesized that the cooling rate of different substances will vary
based on their specific heat capacities. Water, being a substance with a high specific heat
capacity, is expected to cool at a slower rate compared to substances with lower specific heat
capacities.
Background knowledge:
Describe what is a cooling curve and what you will expect to observe
how cooling will occur (in air, water)
What is melting point determination and explain in terms of the 2 substances
Background knowledge:
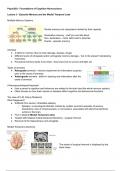
A cooling curve is a graphical representation that shows the temperature changes of a
substance as it cools down from a higher temperature to a lower temperature over a period. It
provides insights into the solidification or freezing process of the substance.
During the cooling process, the substance releases heat energy to its surroundings, causing its
temperature to decrease. The cooling curve typically exhibits distinct phases and features.
Here is what you would expect to observe when analysing a cooling curve:
Unit/Criteria
To achieve the criteria, you must show that you are able to:
reference
Evaluate the accuracy of practical work in calorimetry in relation to the
B.D2 - R - Y
analysis of the cooling curve.
Analyse the rate of cooling of substances from your
B.M2 - R - Y
data using cooling curves to draw valid conclusions.
Correctly obtain data using different equipment to construct cooling
B.P3 - R - Y
curves.
Correctly determine the rate of cooling of substances using cooling
B.P4 - R - Y
curves.
I certify this is my own work:
U2.B: Calorimetry and Cooling curves.
Aim:
I would like to perform 4 cooling curve experiments. I will be using two substrates; one is stearic
acid and the other is paraffin wax. I will be cooling them in both air and water to then observe the
temperature time graphs for the 4 situations.
Hypothesis:
What do you think will happen in the experiment?
In this experiment, it is hypothesized that the cooling rate of different substances will vary
based on their specific heat capacities. Water, being a substance with a high specific heat
capacity, is expected to cool at a slower rate compared to substances with lower specific heat
capacities.
Background knowledge:
Describe what is a cooling curve and what you will expect to observe
how cooling will occur (in air, water)
What is melting point determination and explain in terms of the 2 substances
Background knowledge:
A cooling curve is a graphical representation that shows the temperature changes of a
substance as it cools down from a higher temperature to a lower temperature over a period. It
provides insights into the solidification or freezing process of the substance.
During the cooling process, the substance releases heat energy to its surroundings, causing its
temperature to decrease. The cooling curve typically exhibits distinct phases and features.
Here is what you would expect to observe when analysing a cooling curve: