Summary syllabus BBS1003 Statistics
Chapter 1
Variable
Variable = a label name of a characteristic
bijv. Hair colour may be a variable with possible characteristics
varying from brown, blond and red.
In general, we can distinguish two different variables:
- Qualitative (categorical/discrete): nominal, ordinal
- Quantitative (continuous): interval, ratio
Nominal = different categories with no order
- The space between the scores does not have any meaning
- Categories are not ordered.
Bijv. female = 1 and male = 0
Ordinal = the categories are ordered
Bijv. Social economic class is a variable with low, middle and high.
Interval = contain the same information as nominal and ordinal,
plus the extra information that differences between scores can be
meaningfully interpreted.
Bijv. temperature in °C.
Ratio = there is an absolute zero point
- Ordered
- Space between the scores has meaning
- Ratio of two scores is meaningful
Bijv. age, temperature in K.
Frequency distribution/table
Pagina 1 van 43
,Bar chart
x-axis: outcome/scores
y-axis: frequency
Bar charts are often used to summarize the outcome of a qualitative
variable.
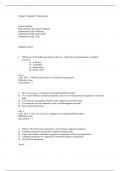
Histogram
Histograms are used for quantitative variables.
Each bar has a surface that is exactly equal to the frequency of the
score represented by that bar and the horizontal end points of each
bar are chosen by the user.
Bijv. We can observe, for example, that there are more
subjects scoring less
than 5, because the bars on the left side of the histogram are
higher.
Grouping
Pagina 2 van 43
,11.3 5.1 12.1 7.8 15.9 8.2 10.7 6.8 10.7 12.9
11.7 12.6 8.1 9.4 12.9 8.2 3.8 11.4 10.3 6.1
Sample size is n = 20, with scores ranging from 3.8 to 15.9. To
create a histogram you choose an equal width of each bar.
A possible width is 3. The boundaries would be between 3.5 and 6.5
for the first class. From the table we can see that there are 3 scores
within the class [3.5, 6.5>, which are 5.1, 3.8 and 6.1. When you do
this for all classes, you get a histogram like below.
Theoretic distribution
When the number of classes becomes very large, you use a theoretic
distribution.
Symmetric and skewed (left or right) distributions will be considered
as a representation of a population distribution.
Bijv. Consider the following sequence: 1, 4, 5, 7. The median will be
somewhere between 4 and 5. It is commonly agreed that we take
Pagina 3 van 43
, the average of these two scores, i.e. (4+5)/2 = 4.5, which is defined
as the median.
In frequency/distribution table, the median is equal to 5. This can be
seen as follows: 45.8% scores less or equal to 4 and the next score
in the sequence is equal to 5, so the median should be at least equal
to 5. Further, 70.8 % scores less or equal to 5. Hence the median
should be less than or equal to 5, i.e. the median is exactly equal to
5.
Right skewed = the mean is always located at the right of the modus
and the median. Because the average value is more sensitive to
large or extreme values.
vice versa for left skewed.
Variance = measure of how peeked/flat the distribution is. It
represents how much the subjects differ from each other regarding
to the scores.
Both the variance and the standard deviation are a measure of
spread. They both represent the same information.
If the summation is not divided by N (taking the average), then
the statistic is called variation. Thus variation of X is equal to N
x var(X).
The standard deviation is more used because it is expressed in
the same scale as the values.
Bijv. if X represents length in inches, then the average value
and the standard deviation are also expressed in inches. The
variance is expressed as ‘square of inches’, which is more
difficult to interpret in practice.
Normal distribution
Pagina 4 van 43
Chapter 1
Variable
Variable = a label name of a characteristic
bijv. Hair colour may be a variable with possible characteristics
varying from brown, blond and red.
In general, we can distinguish two different variables:
- Qualitative (categorical/discrete): nominal, ordinal
- Quantitative (continuous): interval, ratio
Nominal = different categories with no order
- The space between the scores does not have any meaning
- Categories are not ordered.
Bijv. female = 1 and male = 0
Ordinal = the categories are ordered
Bijv. Social economic class is a variable with low, middle and high.
Interval = contain the same information as nominal and ordinal,
plus the extra information that differences between scores can be
meaningfully interpreted.
Bijv. temperature in °C.
Ratio = there is an absolute zero point
- Ordered
- Space between the scores has meaning
- Ratio of two scores is meaningful
Bijv. age, temperature in K.
Frequency distribution/table
Pagina 1 van 43
,Bar chart
x-axis: outcome/scores
y-axis: frequency
Bar charts are often used to summarize the outcome of a qualitative
variable.
Histogram
Histograms are used for quantitative variables.
Each bar has a surface that is exactly equal to the frequency of the
score represented by that bar and the horizontal end points of each
bar are chosen by the user.
Bijv. We can observe, for example, that there are more
subjects scoring less
than 5, because the bars on the left side of the histogram are
higher.
Grouping
Pagina 2 van 43
,11.3 5.1 12.1 7.8 15.9 8.2 10.7 6.8 10.7 12.9
11.7 12.6 8.1 9.4 12.9 8.2 3.8 11.4 10.3 6.1
Sample size is n = 20, with scores ranging from 3.8 to 15.9. To
create a histogram you choose an equal width of each bar.
A possible width is 3. The boundaries would be between 3.5 and 6.5
for the first class. From the table we can see that there are 3 scores
within the class [3.5, 6.5>, which are 5.1, 3.8 and 6.1. When you do
this for all classes, you get a histogram like below.
Theoretic distribution
When the number of classes becomes very large, you use a theoretic
distribution.
Symmetric and skewed (left or right) distributions will be considered
as a representation of a population distribution.
Bijv. Consider the following sequence: 1, 4, 5, 7. The median will be
somewhere between 4 and 5. It is commonly agreed that we take
Pagina 3 van 43
, the average of these two scores, i.e. (4+5)/2 = 4.5, which is defined
as the median.
In frequency/distribution table, the median is equal to 5. This can be
seen as follows: 45.8% scores less or equal to 4 and the next score
in the sequence is equal to 5, so the median should be at least equal
to 5. Further, 70.8 % scores less or equal to 5. Hence the median
should be less than or equal to 5, i.e. the median is exactly equal to
5.
Right skewed = the mean is always located at the right of the modus
and the median. Because the average value is more sensitive to
large or extreme values.
vice versa for left skewed.
Variance = measure of how peeked/flat the distribution is. It
represents how much the subjects differ from each other regarding
to the scores.
Both the variance and the standard deviation are a measure of
spread. They both represent the same information.
If the summation is not divided by N (taking the average), then
the statistic is called variation. Thus variation of X is equal to N
x var(X).
The standard deviation is more used because it is expressed in
the same scale as the values.
Bijv. if X represents length in inches, then the average value
and the standard deviation are also expressed in inches. The
variance is expressed as ‘square of inches’, which is more
difficult to interpret in practice.
Normal distribution
Pagina 4 van 43